Hello! In our last lesson, we explored the Network Time Protocol (NTP) and established why synchronizing clocks across your network devices is a fundamental best practice. Today, we'll put those accurate timestamps to work by configuring Syslog, the standard protocol for network device logging.
This lesson will guide you through setting up a Cisco device to send its event messages to a central syslog server. For your project, this is an essential skill. It enables you to monitor the health of your network, troubleshoot issues effectively, and maintain a security audit trail, all from one consolidated location. We'll cover the structure of syslog messages and then walk through the specific commands to configure and verify basic syslog reporting.
1. The "Why" and "What" of Syslog
Before jumping into configuration, let's clarify what Syslog is and why it's so critical for network management. On its own, a Cisco device stores log messages in its RAM, which means they are lost every time the device reboots. A syslog server provides a centralized, persistent storage solution.
To understand the benefits, watch this brief introductory video from CertBros. It provides a simple but effective analogy for why centralized logging is indispensable as a network grows.
Syslog Explained | Cisco CCNA 200-301
This video explains the purpose and benefits of using a syslog server.
Watch from the beginning to the overview. Pay attention to the three main benefits discussed: centralized management, troubleshooting, and data retention.
As the video highlighted, collecting logs in one place is crucial. This is because network events rarely happen in isolation, and troubleshooting often requires correlating messages from multiple devices. The accurate timestamps, which we configured with NTP in the previous lesson, are what make this correlation possible.
2. Anatomy of a Syslog Message
To effectively use logs, you need to understand their structure. Cisco IOS syslog messages follow a standard format that contains several key pieces of information.
The video below from Jeremy's IT Lab breaks down the components of a typical syslog message and, most importantly, explains the severity levels. These levels are used to classify the urgency of a message and are essential for filtering the logs you send to your server.
Free CCNA | Syslog | Day 41 | CCNA 200-301 Complete Course
This video details the standard format of a syslog message and explains the eight severity levels.
First, watch the section covering the message format. Focus on identifying the key parts: Timestamp Facility (the process that generated the message, e.g., LINK or OSPF) Severity (a number from 0-7 indicating urgency) Mnemonic (a short code for the message, e.g., UPDOWN) Description (the detailed message text) Next, watch the explanation of severity levels. You will need to be familiar with these levels for both your project and the CCNA exam.
Here is a summary of the severity levels for your reference. Remember, the lower the number, the more critical the event.
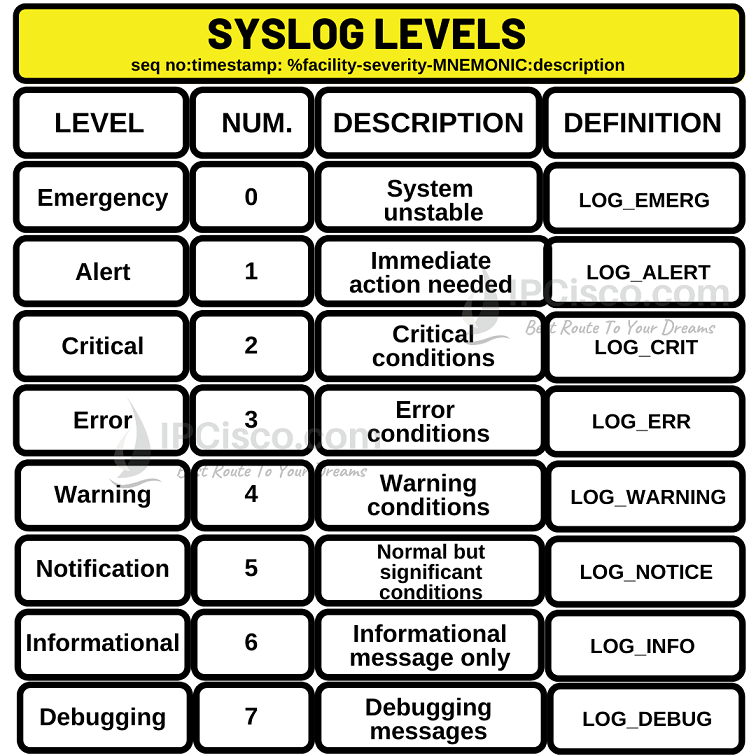
When you configure logging, you will specify a severity level. The device will then send messages of that level and all more severe levels. For example, if you set the logging level to 6 (Informational), the device will send messages with levels 0, 1, 2, 3, 4, 5, and 6.
3. Configuring a Cisco Device to Use a Syslog Server
Now, let's configure a router to send its logs to an external syslog server. The process involves three main steps:
- Tell the router where the server is.
- Specify which severity level of messages to send.
- Ensure timestamps are enabled and formatted correctly.
The image below provides a great visual summary of the basic configuration.
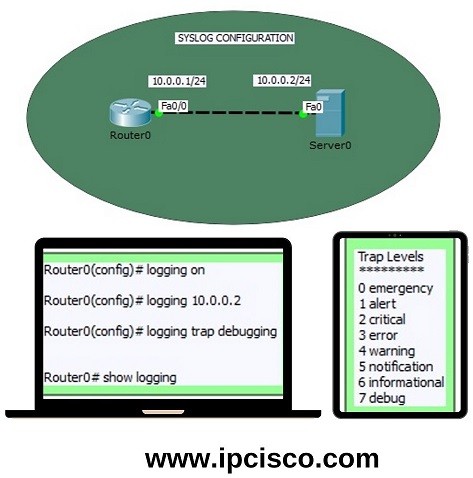
Configuration Commands
Here are the essential commands, which you'll enter in global configuration mode:
-
Set the Syslog Server's IP Address:
This command tells the router the destination for its syslog messages. By default, syslog uses UDP port 514.R1(config)# logging host 192.168.1.100(Replace
192.168.1.100with the actual IP address of your syslog server.) -
Set the Logging Severity Level (Trap Level):
Thelogging trapcommand filters the messages sent to the server based on severity. A common level for production networks isinformational(level 6) ordebugging(level 7) during active troubleshooting.R1(config)# logging trap informationalThis command sends messages of level 6 and higher (0-6) to the server.
-
Enable Timestamps (A familiar step!):
To make logs useful, they need accurate timestamps. We configured NTP to sync the clock; now we ensure those timestamps are included in the log messages.R1(config)# service timestamps log datetime msecThis command adds the date, time, and milliseconds to each log message, which is invaluable for precise event correlation.
The following video segment demonstrates these commands being configured on a Cisco router.
Syslog Explained | Cisco CCNA 200-301
This video provides a practical demonstration of configuring a router to send logs to a Kiwi Syslog Server.
Watch the configuration demo from router setup. The presenter performs the exact steps we've discussed: Sets the clock (we did this with NTP). Enables service timestamps. Sets the logging host with logging 192.168.0.1. Sets the trap level with logging trap informational. Generates some log messages by changing an interface state. After watching the router configuration, observe what happens on the syslog server. You will see the log messages from the router appearing in real-time.
4. Verifying Syslog Configuration
After configuring syslog, you'll want to verify that it's working as expected. The primary command for this is show logging. This command displays the log messages stored in the router's local buffer and also shows the status of your logging configuration.
Cisco IOS Syslog Logging Locations - Study CCNA
This article from Study CCNA shows a clear example of the show logging command output.
Please read the first part of the article, starting from the heading "Let’s take a look and verify..." down to just before the "Security Information and Event Management (SIEM)" section. Focus on the sample output of the show logging command.
From the show logging output, you can confirm:
- The status of logging to the console, monitor (VTY lines), and buffer.
- The IP address of the configured syslog server.
- The number of messages sent to the server.
- A list of recent log messages stored in the local buffer.
Here's an example of what you might see:
R1# show logging
Syslog logging: enabled (0 messages dropped, 1 messages rate-limited, 0 flushes, 0 overruns, xml disabled, filtering disabled)

    Console logging: disabled
    Monitor logging: level debugging, 0 messages logged, xml disabled,
                     filtering disabled
    Buffer logging:  level debugging, 25 messages logged, xml disabled,
                    filtering disabled
    Trap logging: level informational, 27 message lines logged
        Logging to 192.168.1.100 (udp port 514, audit disabled,
              link down), 27 message lines logged

Log Buffer (4096 bytes):
...
*Mar 1 10:32:15.123: %SYS-5-CONFIG_I: Configured from console by console
*Mar 1 10:34:01.456: %LINK-3-UPDOWN: Interface GigabitEthernet0/1, changed state to up
...
In this output, you can see Trap logging: level informational and Logging to 192.168.1.100, which confirms our configuration is active.
Conclusion
You have now learned how to configure one of the most fundamental network management services. By directing device logs to a central syslog server, you create a powerful system for monitoring, troubleshooting, and security analysis.
Key Takeaways:
- Purpose: Syslog provides a standardized way to forward event messages from network devices to a central server for storage and analysis.
- Message Structure: Syslog messages include a timestamp, facility, severity level (0-7), mnemonic, and a descriptive message.
- Severity Levels: These levels (0=Emergency, 7=Debugging) allow you to filter which messages are important enough to be sent to the server.
- Core Configuration Commands:
logging host <server-ip>: Sets the destination server.logging trap <level>: Filters messages based on severity.service timestamps log datetime: Ensures logs have accurate timestamps.
- Verification: The
show loggingcommand is your primary tool to check the logging status and view recent messages.
In our next module, we will dive into Switch and Device Security. You will see how the logging system you've just configured is a critical first line of defense in detecting security events like MAC flooding, DHCP spoofing, and unauthorized access attempts.