Hello! Welcome to your next lesson on backend development with Spring Boot.
In our previous lesson, we dove into the essential practice of logging, learning how to configure log levels and formats to gain visibility into your application's behavior. Today, we'll take that visibility to the next level. While logs tell you what happened, you also need to know how your application is doing in real-time. Is it healthy? How much memory is it using? How fast is it responding to requests?
This lesson will introduce you to Spring Boot Actuator, a powerful module that provides production-ready features for monitoring your application. We will focus on how to enable and use its most important endpoints to check your application's health and inspect key performance metrics. This is a fundamental skill for building reliable, enterprise-grade services.
1. What is Spring Boot Actuator?
At its core, Spring Boot Actuator brings observability to your application by exposing operational information through a set of built-in endpoints, which are accessible via HTTP or JMX (Java Management Extensions). Think of it as a built-in dashboard API for your application's internal state.
With Actuator, you don't have to write complex, boilerplate code to monitor things like JVM memory usage, database connection status, or HTTP request statistics. Spring Boot provides it for you, allowing you to focus on your business logic.
To start, let's get a formal definition of Spring Boot Actuator and its purpose. The Baeldung guide offers a clear and concise introduction.
Please read the first two sections, "1. Overview" and "2. What Is an Actuator?". Focus on understanding the main benefit of Actuator: getting production-grade tools without having to implement them yourself.
2. Enabling and Configuring Actuator
Getting started with Actuator is straightforward. It involves two main steps: adding the dependency and configuring which endpoints to expose.
2.1. Adding the Dependency
First, you need to add the spring-boot-starter-actuator dependency to your project's pom.xml file. Spring Boot's dependency management will handle the rest.
<dependency>
    <groupId>org.springframework.boot</groupId>
    <artifactId>spring-boot-starter-actuator</artifactId>
</dependency>
Once this dependency is on your classpath, Actuator is enabled. However, for security reasons, Spring Boot does not expose most endpoints over HTTP by default.
2.2. Exposing Endpoints
By default, only the /actuator/health and /actuator/info endpoints are exposed. To access the rich set of metrics and operational data, you must explicitly tell Spring Boot which endpoints to make available. You do this in your application.properties file.
Monitoring Spring Boot Applications Using Actuator Metrics
The article "Monitoring Spring Boot Applications Using Actuator Metrics" provides a very clear summary of how to expose endpoints.
Please read section 3, "Configuring Actuator Endpoints". This section shows the essential properties for exposing all endpoints or just specific ones.
As you've just read, here are the key configuration properties:
-
To expose all endpoints (common during development):
management.endpoints.web.exposure.include=* -
To expose only specific endpoints (a more secure practice for production):
# Expose only health, info, and metrics endpoints management.endpoints.web.exposure.include=health,info,metrics -
To exclude specific endpoints:
# Expose all endpoints except the environment one
management.endpoints.web.exposure.include=*
management.endpoints.web.exposure.exclude=env
Test your understanding!
For a production environment, your team has decided to expose the health, metrics, and loggers endpoints but wants to ensure that the shutdown endpoint is never accessible via HTTP, even if it's enabled. How would you configure this in application.properties?
Show answer
You would explicitly list the endpoints you want to include. This is safer than exposing all and then excluding one.
management.endpoints.web.exposure.include=health,metrics,loggers
By only including these three, you guarantee that shutdown and any other endpoints are not exposed over the web.
3. Exploring Key Actuator Endpoints
Once you've configured your endpoints, you can start exploring them. By default, all actuator endpoints are available under the /actuator base path.
3.1. The Discovery Endpoint: /actuator
The first place to visit is /actuator itself. This endpoint provides a "discovery page" that lists all other exposed endpoints with their corresponding URLs. It's a hypermedia-driven way to see what's available.
If you hit http://localhost:8080/actuator in your browser or with a tool like curl, you'll get a JSON response like this:
{
  "_links": {
    "self": { "href": "http://localhost:8080/actuator", "templated": false },
    "health": { "href": "http://localhost:8080/actuator/health", "templated": false },
    "metrics": { "href": "http://localhost:8080/actuator/metrics", "templated": false },
    // ... other endpoints
  }
}
3.2. The Health Endpoint: /actuator/health
This is arguably the most important endpoint. It provides essential information about your application's health. Automated systems (like load balancers or container orchestrators) often use this endpoint to determine if your application instance is running correctly and ready to receive traffic.
-
Basic View: By default, a request to
/actuator/healthreturns a simple status:{ "status": "UP" }The status will be
UPif all components are healthy. If any critical component (like the database connection) is down, the overall status will becomeDOWN. -
Detailed View: To see the status of individual components, you can enable a more detailed view in your
application.properties:management.endpoint.health.show-details=alwaysWith this setting, the response will include checks for disk space, database connectivity (if using Spring Data JPA), and other auto-configured components:
{
  "status": "UP",
  "components": {
    "db": {
      "status": "UP",
      "details": {
        "database": "MySQL",
        "validationQuery": "SELECT 1"
      }
    },
    "diskSpace": {
      "status": "UP",
      "details": {
        "total": 499963170816,
        "free": 90123456789,
        "threshold": 10485760
      }
    },
    "ping": { "status": "UP" }
  }
}
3.3. The Metrics Endpoint: /actuator/metrics
While /health gives a high-level status, /metrics provides a wealth of granular, quantitative data about your application's performance. Spring Boot uses the Micrometer library to collect these metrics.
Exploring metrics is a two-step process:
-
List Available Metrics: First, make a
GETrequest to/actuator/metrics. This will return a JSON object containing the names of all available metrics.{ "names": [ "jvm.memory.used", "jvm.threads.live", "system.cpu.usage", "http.server.requests", "hikaricp.connections.active", // ... and many more ] } -
View a Specific Metric: To see the details of a particular metric, make a
GETrequest to/actuator/metrics/{metric.name}. For example, to check JVM memory usage, you would request/actuator/metrics/jvm.memory.used. The response provides the value, along with other useful metadata like available tags for further filtering.{ "name": "jvm.memory.used", "description": "The amount of used memory", "baseUnit": "bytes", "measurements": [ { "statistic": "VALUE", "value": 2.5165824E8 } ], "availableTags": [ { "tag": "area", "values": ["heap", "nonheap"] }, { "tag": "id", "values": ["G1 Survivor Space", "G1 Old Gen", ...] } ] }
The Stackademic article provides a great summary of the most useful metric categories.
Monitoring Spring Boot Applications Using Actuator Metrics
Let's review the key metric categories you can monitor with Actuator.
Please read section 4, "Key Metrics Exposed by Actuator", including subsections 4.1 through 4.4. This will give you a solid overview of the types of data you can get, from JVM memory to HTTP request latencies.
3.4. Other Useful Endpoints
Actuator provides many other endpoints. Here are two more that are especially useful:
/actuator/loggers: This endpoint allows you to view and modify the logging levels of your application at runtime. This is incredibly powerful for debugging production issues. You can temporarily set a specific logger toDEBUGto get more information without restarting the application./actuator/env: This displays all the properties from your application's environment, including system properties, environment variables, and properties from yourapplication.propertiesfiles. It's a great way to verify that your configuration is loaded as expected.
4. Visualizing Metrics: From JSON to Dashboards
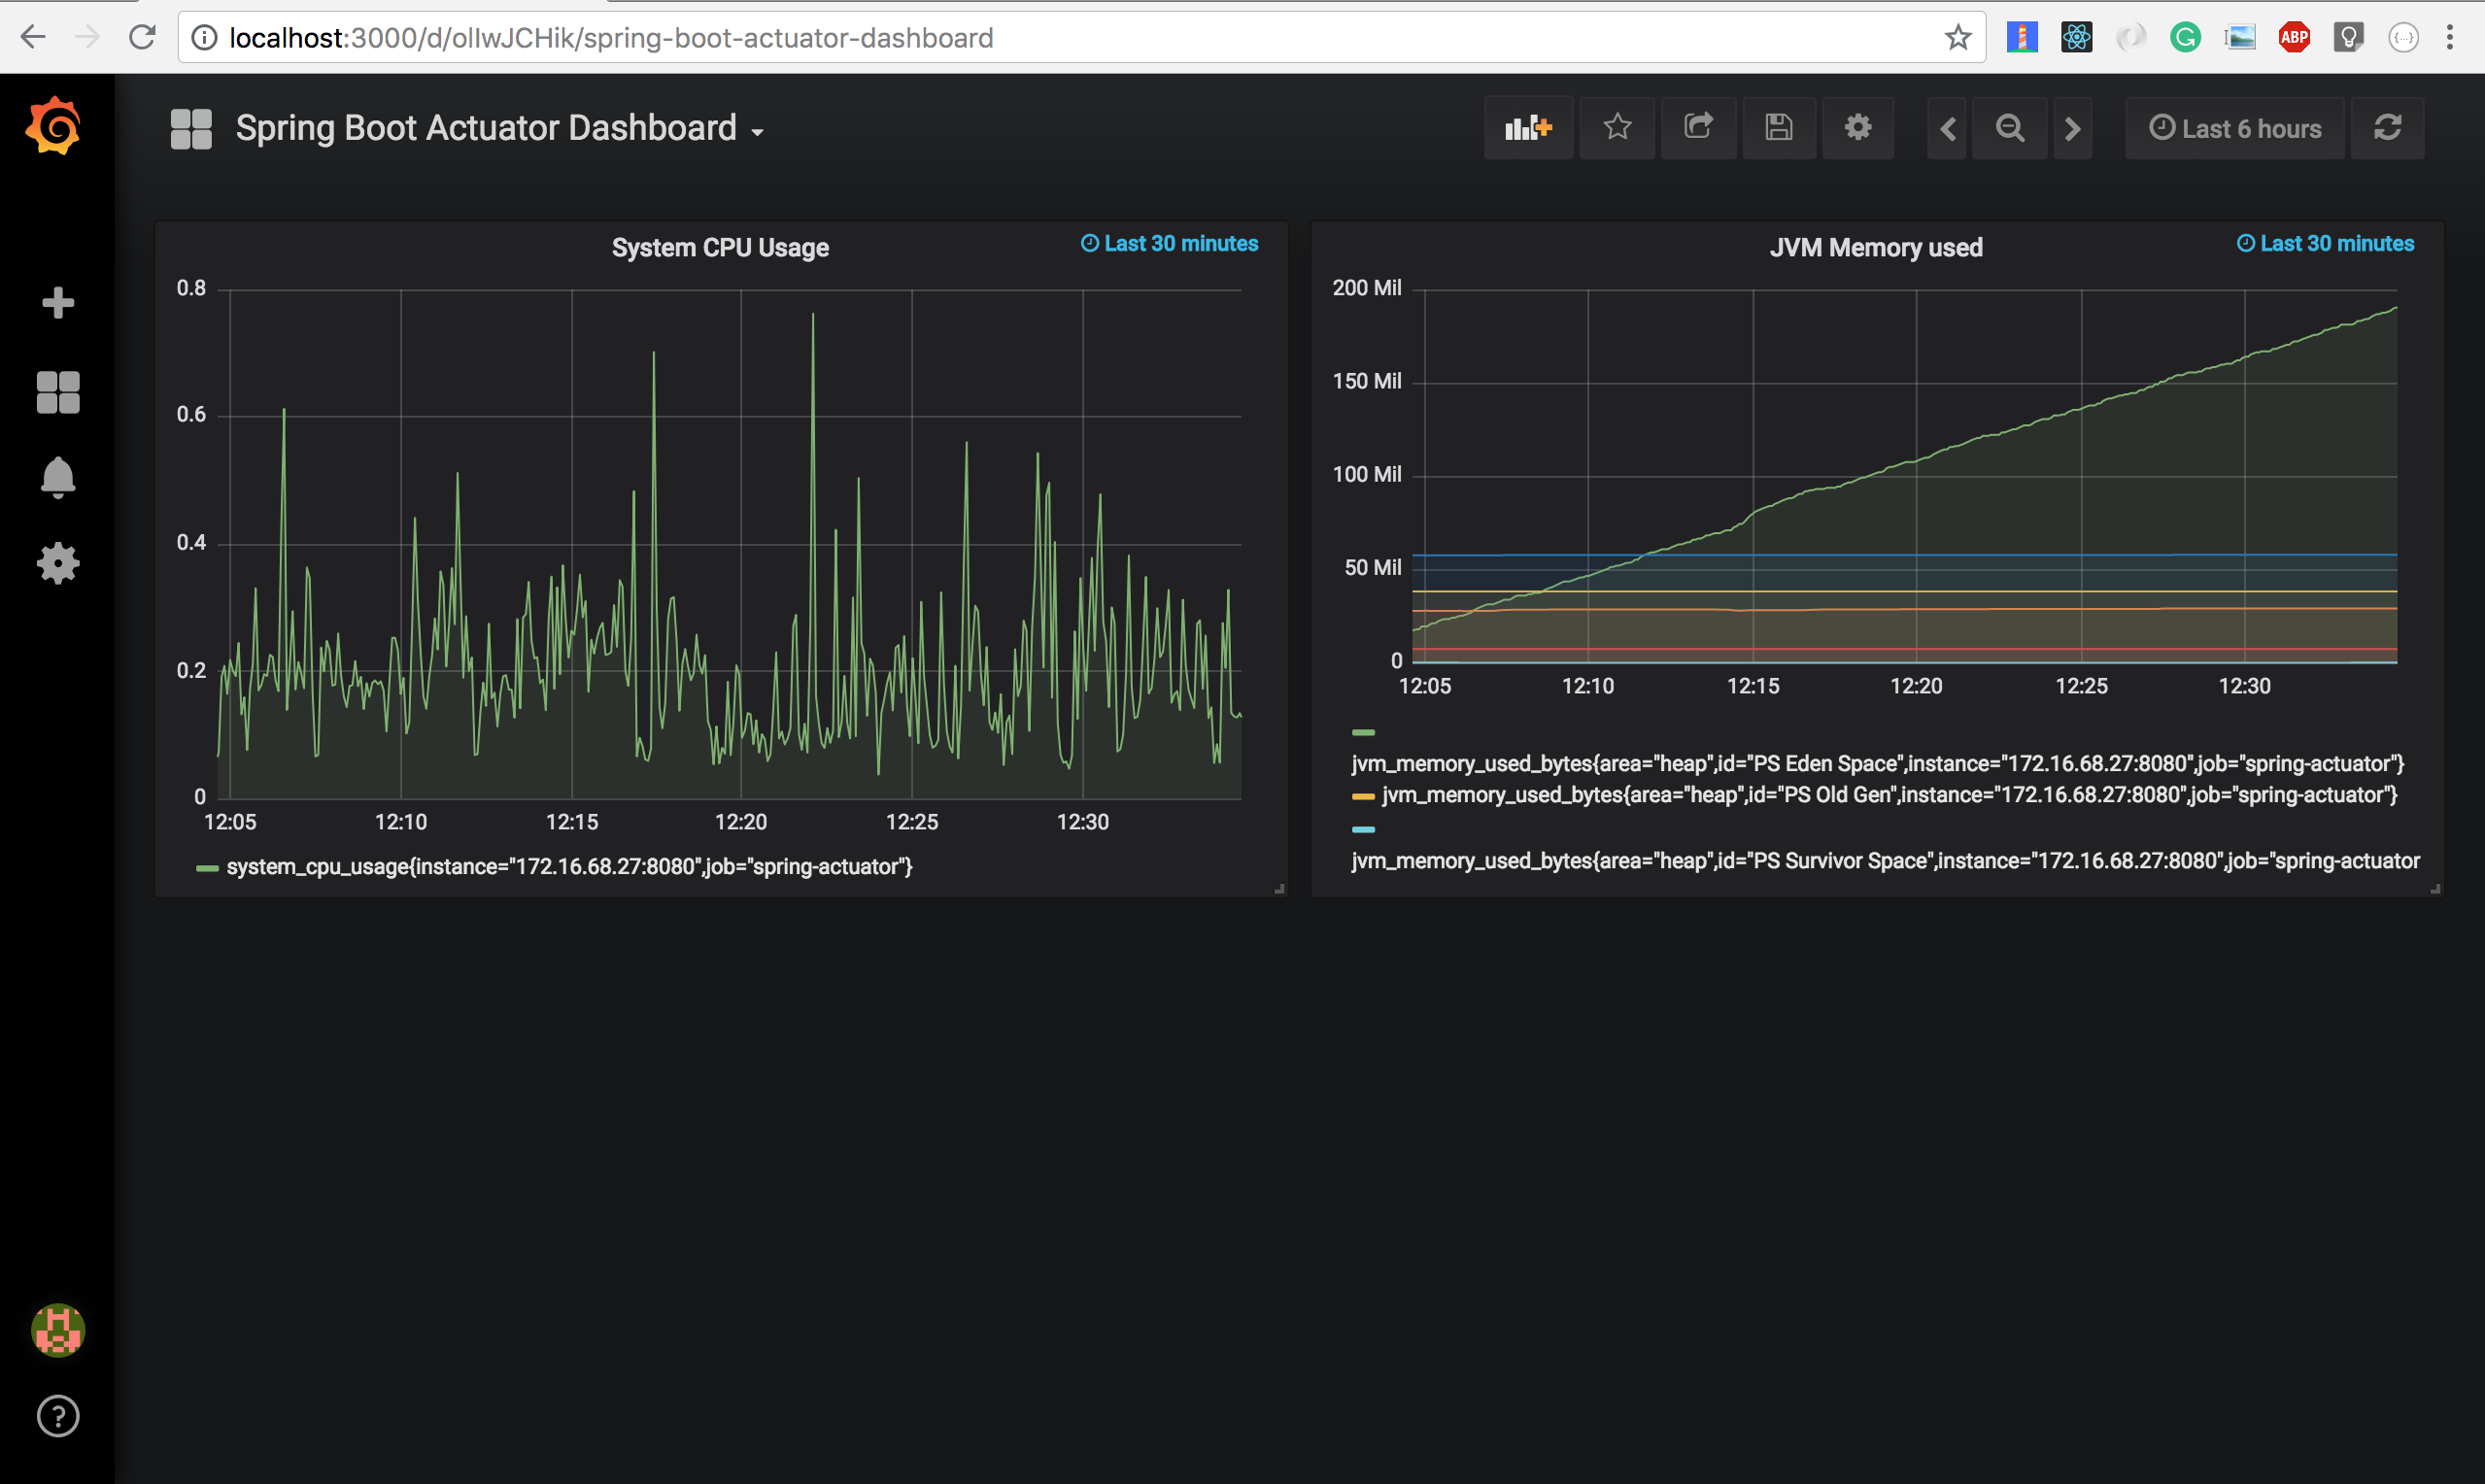
While accessing raw JSON data from Actuator endpoints is great for ad-hoc checks and automated scripts, it's not ideal for human-centric monitoring. The real power of Actuator's metrics is realized when they are scraped by a dedicated monitoring system like Prometheus and visualized in a dashboarding tool like Grafana.
Actuator includes a /prometheus endpoint that exposes metrics in a format that Prometheus can directly consume. This allows you to track trends over time, set up alerts, and create rich, informative dashboards.
Conclusion
Congratulations! You've just learned how to integrate and use one of the most important components for building production-ready Spring Boot applications. By leveraging Spring Boot Actuator, you can gain deep insights into your application's health and performance with minimal effort.
Key Takeaways:
- Spring Boot Actuator provides monitoring and management capabilities through HTTP endpoints.
- You must add the
spring-boot-starter-actuatordependency and expose the desired endpoints usingmanagement.endpoints.web.exposure.include. - The
/actuator/healthendpoint gives a high-level summary of your application's operational status. - The
/actuator/metricsendpoint provides access to detailed performance data, such as JVM usage, CPU load, and HTTP request statistics. - Actuator is designed to integrate with modern monitoring systems like Prometheus and Grafana for powerful visualization and alerting.
What's Next?
We've seen how to monitor application performance. In our next lesson, we will shift our focus to a key technique for improving that performance: caching. We will explore how Spring's caching abstractions work and learn to implement method-level caching with the @Cacheable annotation to speed up your application and reduce database load.