Hello! Welcome to the first lesson in our module on Averages and Mixtures.
In our previous module, we saw how quantities can be related through proportions and variation. Today, we shift our focus to a concept that is central to data interpretation and a frequent topic in the CAT exam: averages. The average of a set of numbers gives us a single, representative value for the entire set.
Your learning outcome for this lesson is to solve problems involving simple, weighted, and combined averages. We will start with the basic definition you're likely familiar with, then move to scenarios where different data points have different levels of importance (weighted average), and finally, learn a powerful shortcut method to speed up your calculations—a crucial skill for any timed exam.
1. Simple Average: The Basic Building Block
A simple average, or arithmetic mean, is the most common type of average. You use it when all the data points you are considering have equal importance. The fundamental formula is one you likely know:
For the CAT, it's often more useful to rearrange this formula:
This rearrangement is the key to solving many word problems.
To ensure we have a solid foundation, let's review the formal definition and the conditions under which a simple average is used.
4.1 Simple and Weighted Averages
This resource, '4.1 Simple and Weighted Averages' from the eCampusOntario pressbook, provides a clear, structured definition of a simple average. It's a good refresher on the fundamentals.
Read the section titled 'Simple Averages'. Pay close attention to the three conditions listed under 'Important Notes' for when a simple average is appropriate.
Key Properties of Averages
Understanding how averages behave when data changes can lead to significant shortcuts. The following properties, drawn from the "Concept of average and short tricks" article by Bodhee Prep, are worth noting:
- If every number in a set is increased or decreased by a value
n, the average of the set also increases or decreases byn. - If every number in a set is multiplied or divided by a value
n, the average also gets multiplied or divided byn.
These rules allow you to simplify calculations by working with smaller, more manageable numbers.
2. Weighted Average: When Not All Data is Equal
What happens when some data points are more significant than others? For instance, in calculating your GPA, a 5-credit course has more impact than a 3-credit course. In these cases, we use a weighted average.
The core idea is to give more "weight" to the more important values. The formula is:
Here:
- represents each data value.
- represents the corresponding weight (or frequency) of that value.
Let's look at a visual explanation to make this concrete.

Now, let's dive into a more detailed explanation of the formula and its application.
4.1 Simple and Weighted Averages
Let's return to the '4.1 Simple and Weighted Averages' resource. The section on weighted averages uses a GPA calculation, which is a perfect real-world example.
Read the section titled 'Weighted Averages'. Focus on understanding how credit hours act as 'weights' and grade points act as the 'data'. The 'Things To Watch Out For' subsection is particularly important for avoiding common errors.
Test your understanding!
A student's scores in three tests are 70, 85, and 90. The tests are weighted at 20%, 30%, and 50% of the final grade, respectively. What is the student's final weighted score?
Show answer
Here, the scores are the data values () and the percentages are the weights ().
The sum of weights is .
The sum of the products of weights and scores is:
The weighted average is:
The student's final score is 84.5.
(Note: When weights are percentages that add up to 100, you can also convert them to decimals: )
3. Combined Average: Merging Groups
A "combined average" problem is a common application of the weighted average. This is where you need to find the overall average for two or more groups when you know the average and size of each individual group. In this scenario, the size of each group acts as its weight.
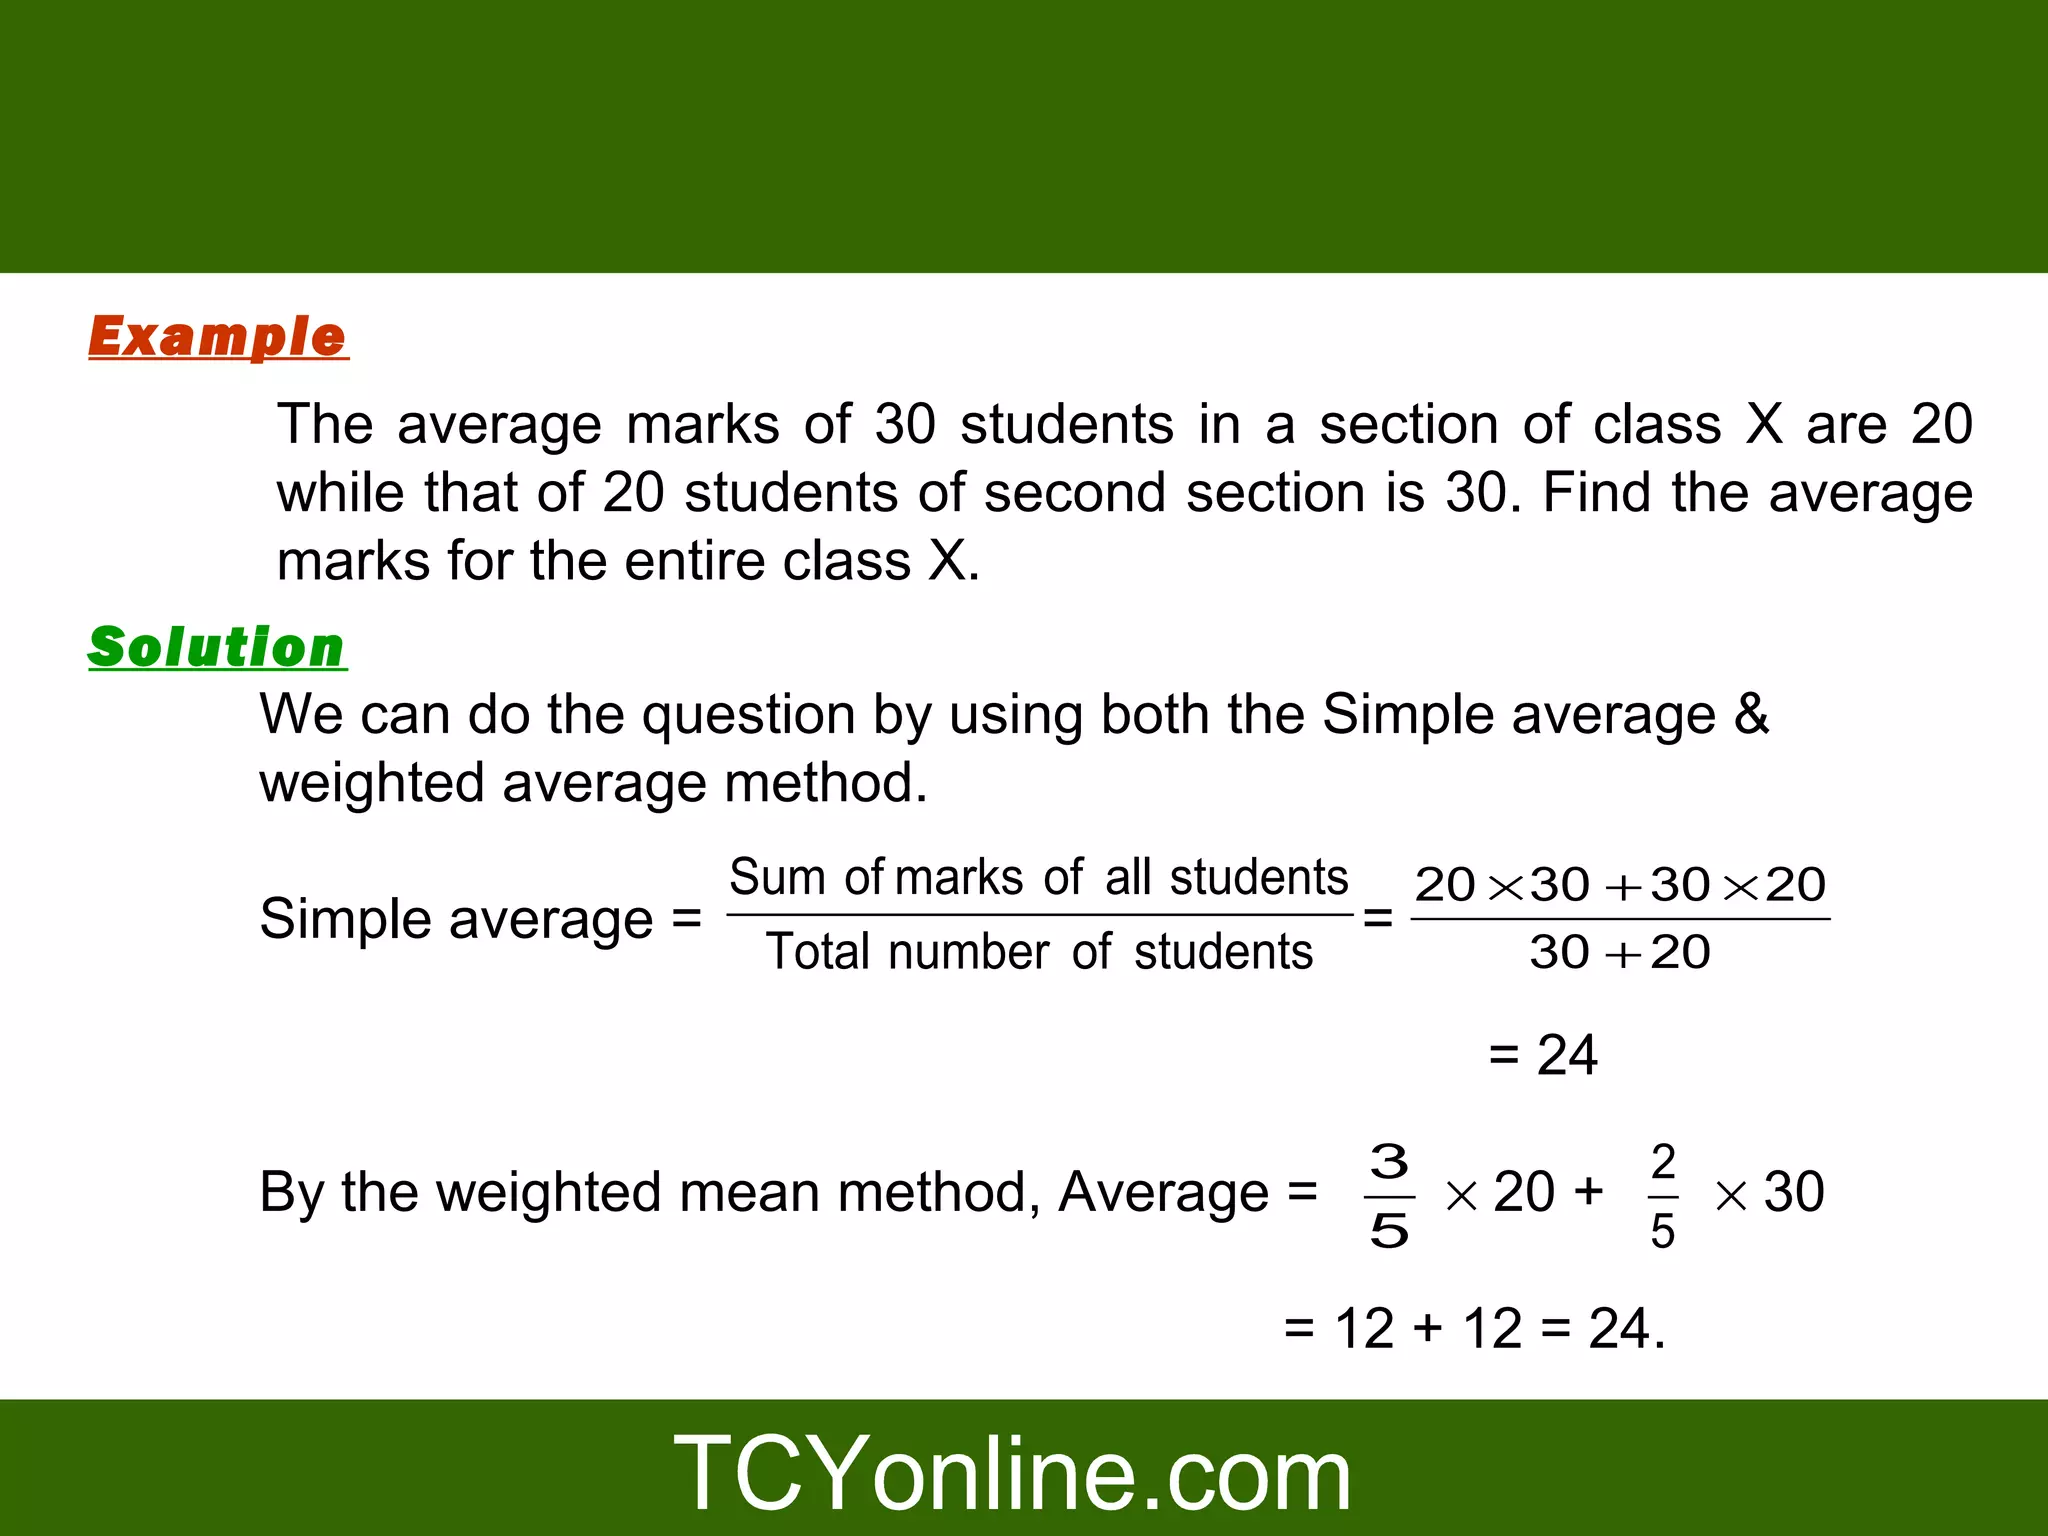
As you can see from the image, you can solve this by calculating the total marks of all students and dividing by the total number of students. This is identical to applying the weighted average formula where:
- The data values () are the averages of the individual groups.
- The weights () are the number of items in each group.
For the example in the image:
4. The Deviation Method: A Shortcut for Speed
The standard formulas are reliable, but they can involve large calculations, which are slow and prone to error under exam pressure. The deviation method is an elegant shortcut that works with the differences (deviations) from an assumed average, keeping the numbers small and manageable.
Let's see how it works for a weighted average problem.
Concept of average and short tricks [Method of Deviation] for ...
The article 'Concept of average and short tricks [Method of Deviation] for CAT Exam' explains this technique well. We will focus on its application to weighted averages.
Read the section 'The concept of weighted mean/average'. First, review the 'Standard approach' for the example about the heights of boys and girls. Then, carefully read the 'Deviation Approach' and follow the logic of assuming a baseline average and distributing the 'excess chocolates'.
Let's break down the deviation method for that example step-by-step:
Problem: In a class of 25 boys and 15 girls, the average heights are 150 cm and 140 cm, respectively. Find the average height of the class.
Deviation Method Steps:
-
Assume a Baseline Average: Choose one of the averages as a baseline. It's usually easiest to pick the smaller one. Let's assume the average height of the whole class is 140 cm.
-
Calculate the Surplus (or Deficit):
- The girls' average height is 140 cm, so there is no deviation for them. Their total surplus is .
- The boys' average height is 150 cm, which is 10 cm above our assumed baseline. Their total surplus is .
-
Distribute the Total Surplus: The total surplus of 250 cm needs to be distributed equally among everyone in the class. The total number of people is .
- Extra height per person = .
-
Calculate the True Average: Add the distributed surplus to the baseline average.
- True Average = .
This method avoided large multiplications (like ) and led to the same result with simpler arithmetic. Mastering this will save you valuable time.
Conclusion
In this lesson, we have built a comprehensive understanding of averages, from the simple to the complex, and equipped you with a powerful shortcut for exam day.
Key Takeaways:
- Simple Average: Used when all data points have equal importance. The key formula is
Sum = Average × Count. - Weighted Average: Used when data points have different frequencies or importance. The size of a group or its given weight determines its influence on the final average.
- Combined Average: A common application of weighted average, used to find the overall average of multiple groups.
- Deviation Method: A fast and efficient shortcut that involves assuming a baseline average and distributing the total surplus or deficit across all items.
In our next lesson, we will continue to build on these concepts. We will specifically analyze the effect on the average when items are added, removed, or replaced in a group, a classic problem type where the deviation method proves especially useful.