Hello! Welcome to the next lesson in our journey toward algorithmic trading.
In our previous session, we mastered the calculation of rolling window statistics like moving averages and historical volatility. We saw how to use Pandas to transform a raw price series into dynamic indicators of trend and risk. However, all that analysis was performed on data we assumed was already available. Today, we address the fundamental question: where does that data come from?
This lesson focuses on the learning outcome: Fetch historical market data using APIs and prepare it for analysis. This is the starting point of any quantitative trading workflow. An algorithm is only as good as the data it's fed, and learning to acquire high-quality data programmatically is a non-negotiable skill. We will explore two powerful tools: yfinance, for broad, free access to global market data, and the Zerodha Kite Connect API, the professional-grade tool you'll use for Indian market data, especially derivatives, and eventually, for executing trades.
1. Broad Market Access with yfinance
For general research, backtesting on major indices, or analyzing global stocks, yfinance is an excellent and easy-to-use library. It scrapes data directly from Yahoo Finance. It's the perfect tool to quickly test a hypothesis without the setup overhead of a broker-specific API.
To get a comprehensive understanding of how to use it, please watch the following video. It covers everything from fetching data for a single stock to downloading data for a list of market indices and performing basic cleaning.
Financial Data with Python: yfinance
The video 'Financial Data with Python: yfinance' by Data Science for Everyone is a thorough guide to using the yfinance library. It will show you how to fetch various types of data and process it with Pandas.
Please watch the video from the beginning until 22:59. Focus on these key actions: Fetching data for a single ticker: yf.Ticker() and .history(). Fetching data for multiple tickers: yf.download() with a list of symbols. Data preparation: How the video handles the multi-index DataFrame returned by yf.download() and deals with missing data using .dropna().
As you saw in the video, yfinance is incredibly powerful. The process of scraping a list of tickers from a webpage and then passing that list to yf.download() is a common and efficient workflow for gathering data on a market sector or index components.
Here's a practical example you can run yourself. This script fetches data for a few key Indian stocks, selects only the 'Adj Close' column, and removes any rows with missing data, preparing a clean dataset for analysis.
import yfinance as yf
import pandas as pd


# Define Indian stock tickers (Yahoo Finance uses '.NS' suffix for NSE)
tickers = ['RELIANCE.NS', 'TCS.NS', 'HDFCBANK.NS', 'INFY.NS']


# Download historical data from 2020 to the end of 2023
try:
    data = yf.download(tickers, start='2020-01-01', end='2023-12-31')


    # --- Data Preparation ---
    # The result is a multi-index DataFrame. We want to work with adjusted close prices.
    adj_close_df = data['Adj Close']


    # Drop rows where any of the tickers have missing data
    adj_close_df.dropna(inplace=True)

    print("Successfully fetched and prepared data. Here are the last 5 rows:")
    print(adj_close_df.tail())

except Exception as e:
    print(f"An error occurred: {e}")
This clean adj_close_df DataFrame is now ready for the type of rolling window analysis we performed in the last lesson.
2. Professional-Grade Data with Zerodha Kite Connect
While yfinance is great for equities and indices, your goal of building professional quant strategies requires access to high-fidelity data for futures and options. This is where a broker's API, like Zerodha's Kite Connect, becomes essential.
The workflow involves three main steps:
- One-Time Setup: You create a developer "app" in your Zerodha account to get an
api_keyandapi_secret. - Daily Authentication: You use your credentials to generate a temporary
access_token. This token proves to the API that you are authorized to access data and place trades. - API Calls: You use the
access_tokento make requests, such as fetching historical data.
The authentication process is the most complex part. The following video explains it perfectly.
Algorithmic Trading with Zerodha Kite Connect: Setting Up Your API Ecosystem (Part 2/5)
The video 'Algorithmic Trading with Zerodha Kite Connect' from QuantInsti provides a step-by-step walkthrough of the entire setup and authentication flow.
Please watch from the beginning to 06:45. This is the most critical part of using the Kite API. Part 1 (00:00 - 03:12): Focus on how to create a developer app to get your api_key and api_secret. Part 2 (03:12 - 06:45): Pay close attention to the 4-step manual authentication process to generate the daily access_token from a request_token. This is a crucial daily ritual for any trading bot.
Fetching Data with Kite Connect
Once you have your api_key, api_secret, and have generated a valid access_token, you can start fetching data. Before you can request data for an instrument, you need its unique identifier, the instrument_token.
You can get a full list of all tradable instruments using the instruments() method. This is a large file, so you typically download it once a day and save it locally.
The official Kite Connect API documentation is your ultimate reference. Let's look at the specific sections for getting the instrument list and historical data.
Please review two key methods in this documentation: instruments(): Skim the description to understand that this method retrieves the list of all available instruments. historical_data(): Read this section carefully. Note the parameters it requires: instrument_token, from_date, to_date, and interval. Also, note the oi flag, which is essential for options and futures analysis.
A Complete Kite Connect Example
The following script combines everything: authentication, fetching the instrument list, finding the token for NIFTY 50, and downloading its historical data.
Note: You must replace 'YOUR_API_KEY', 'YOUR_API_SECRET', and the request_token part with your actual credentials obtained from the process shown in the video.
from kiteconnect import KiteConnect
import pandas as pd
import os


# --- Step 1: Authentication (as shown in the video) ---
api_key = 'YOUR_API_KEY'
api_secret = 'YOUR_API_SECRET'


# Create a KiteConnect instance
kite = KiteConnect(api_key=api_key)


# First, you need to manually generate a request_token.
# 1. Go to kite.login_url()
# 2. Log in with your Zerodha credentials.
# 3. You will be redirected to a URL with a `request_token` parameter. Copy it.
print("Login URL: ", kite.login_url())
request_token = input("Please enter the request_token from the URL: ")

try:


    # Generate an access_token using the request_token
    data = kite.generate_session(request_token, api_secret=api_secret)
    kite.set_access_token(data["access_token"])
    print("\nAuthentication successful!")


    # --- Step 2: Get Instrument List and Find Token ---
    # It's good practice to save the instrument list to a file to avoid fetching it every time.
    instrument_dump_file = 'instruments.csv'
    if not os.path.exists(instrument_dump_file):
        instrument_dump = kite.instruments()
        instrument_df = pd.DataFrame(instrument_dump)
        instrument_df.to_csv(instrument_dump_file, index=False)
        print("\nDownloaded and saved instrument list.")
    else:
        instrument_df = pd.read_csv(instrument_dump_file)
        print("\nLoaded instrument list from local file.")


    # Find the instrument_token for NIFTY 50 index
    instrument_name = 'NIFTY 50'
    try:
        token_info = instrument_df[
            (instrument_df.name == instrument_name) &
            (instrument_df.exchange == 'NSE')
        ].iloc[0]
        instrument_token = token_info['instrument_token']
        print(f"\nFound Instrument Token for {instrument_name}: {instrument_token}")


        # --- Step 3: Fetch Historical Data ---
        from_date = "2023-01-01 09:15:00"
        to_date = "2023-01-31 15:30:00"
        interval = "5minute" # Other options: 'day', 'minute', '3minute', '10minute', etc.

        print(f"\nFetching {interval} data for {instrument_name} from {from_date} to {to_date}...")
        records = kite.historical_data(instrument_token, from_date, to_date, interval, oi=False)


        # --- Step 4: Prepare Data for Analysis ---
        # Convert the list of dictionaries to a Pandas DataFrame
        historical_df = pd.DataFrame(records)
        historical_df['date'] = pd.to_datetime(historical_df['date'])
        historical_df.set_index('date', inplace=True)

        print("\nData fetched and prepared. Here's the first 5 rows:")
        print(historical_df.head())

    except IndexError:
        print(f"\nCould not find instrument token for '{instrument_name}'. Please check the name.")

except Exception as e:
    print(f"\nAn error occurred: {e}")
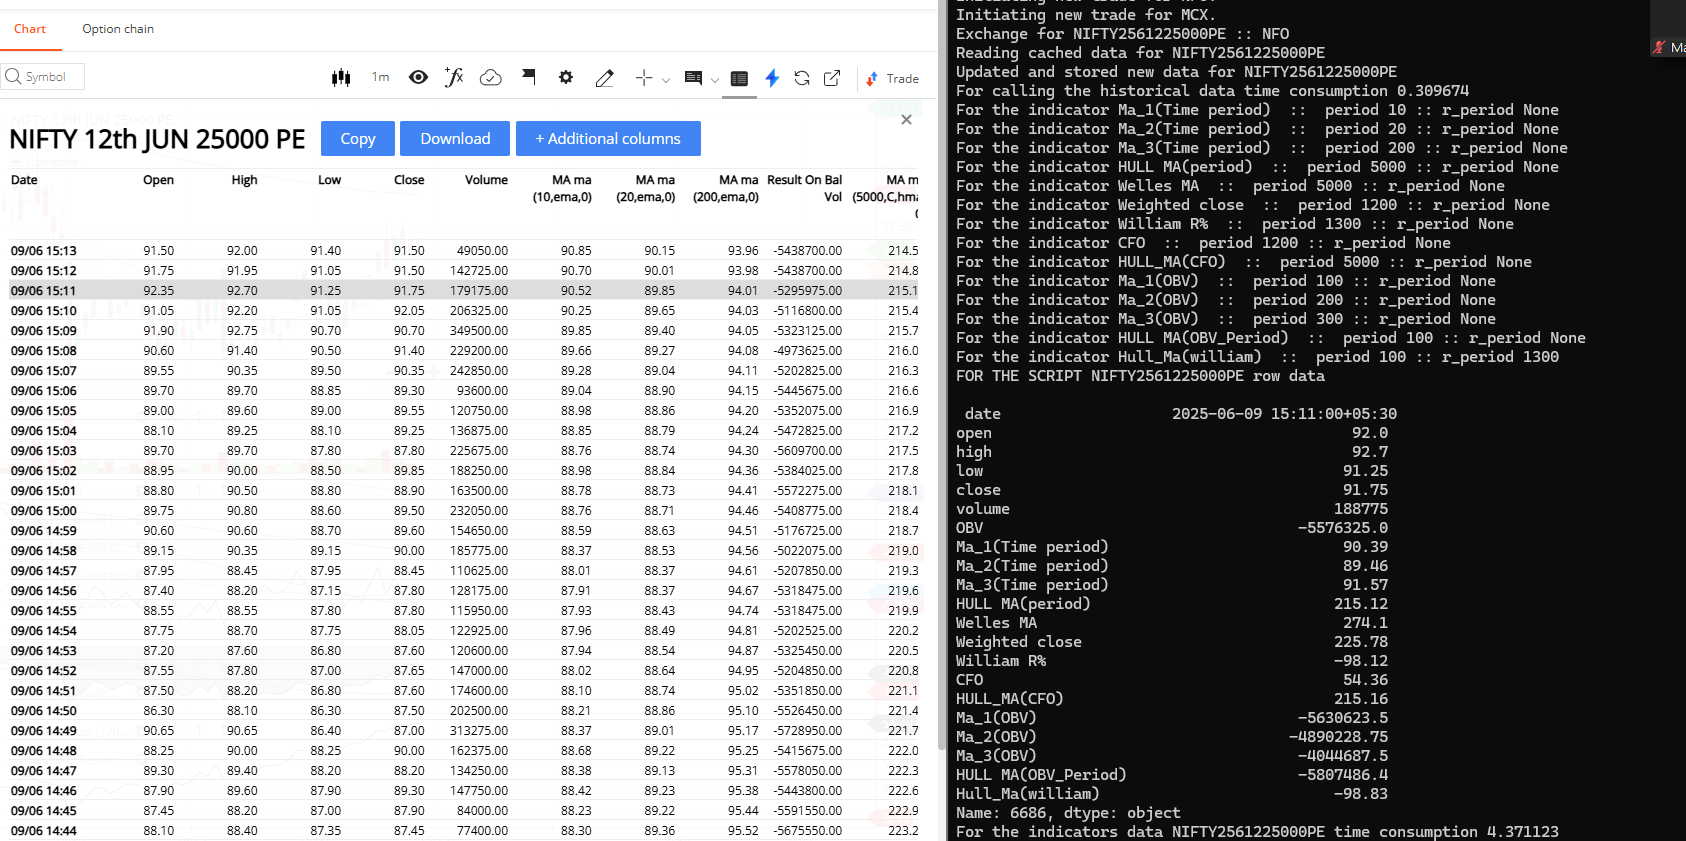
The output of this script is a clean, time-indexed Pandas DataFrame, ready for the kind of analysis and visualization you've already learned to do. This process allows you to get high-quality data for any instrument on Zerodha, including specific option contracts.
Conclusion
You have now built the most critical piece of your quantitative trading infrastructure: the data pipeline. You've learned how to source data from two distinct, powerful APIs and prepare it for analysis.
Key Takeaways:
- APIs are your gateway to market data. They allow for systematic, repeatable, and scalable data acquisition.
yfinanceis a versatile tool for quick access to global equity and index data, ideal for initial research.- Broker APIs like Kite Connect are essential for serious trading. They provide access to high-fidelity derivatives data and are the bridge to eventual trade execution.
- The data pipeline is consistent: API Call -> Raw Data (JSON/list) -> Pandas DataFrame -> Analysis.
- In the Kite Connect ecosystem, the
instrument_tokenis the unique key required to fetch data for any specific asset.
Preview of the Next Lesson:
Now that we have the power to fetch data for any instrument, including options and futures, we are perfectly positioned to dive into the mechanics of these products. In the next lesson, we will begin Module 2 by exploring the roles of exchanges, clearing houses, and market participants in Indian derivatives markets. We will also learn to interpret the contract specifications for instruments like Nifty options, a skill that relies directly on the data-fetching abilities you've acquired today.