Welcome to the fourth lesson of our course. In the previous lessons, we've built a comprehensive understanding of the PM POSHAN scheme: its ideal state, the common real-world violations, and the significant gaps in the current monitoring systems. The failure of traditional oversight makes a clear case for a new, data-driven approach. Now, we shift our focus from the problem domain to the data you will use to solve it.
Today, your goal is to map the project's available data sources (images, text, and metadata) to the specific types of information each can provide. This is a foundational step in any machine learning project: before you build any models, you must deeply understand your data's strengths and limitations. We will systematically dissect each data type—or modality—to see what evidence, or signals, it contains about the meal quality violations we've previously identified. This exercise will set the stage for the next module, where we will translate these signals into formal machine learning tasks.
A Framework for Multimodal Sensing
Your project is inherently multimodal, meaning it integrates data from different sources and formats. This is a powerful approach because different data types often provide complementary information, creating a more complete picture than any single source could alone. To give this a scientific grounding, it's helpful to think of your data sources as different kinds of sensors.
A recent review article in the journal Food Science & Nutrition provides an excellent overview of how various sensor technologies are used for real-time food safety and quality monitoring. While the paper discusses advanced industrial sensors, the underlying principles are directly relevant to your project.
This article will provide you with a structured way to think about different data modalities and the information they carry. It will help you see your project's data sources as part of a broader landscape of sensing technologies.
Please read the following subsections in Section 2, "Sensing and Data Modalities Across the Food Chain": Subsection 2.1, "Optical and Imaging Sensor": Focus on how different imaging types (like RGB) are used to detect visible issues. This directly relates to your use of meal photos. Subsection 2.5, "Process and Logistics Telemetry": Read this section to understand how contextual data, such as environmental and traceability data, are used. This is analogous to the metadata you will be using (location, time, school type). Pay attention to Table 1, which summarizes the strengths and limitations of each modality. This framework will be useful as we analyze your specific data sources.
As you read, consider how your data sources—images, text, and metadata—act as proxies for these more formal sensor types. A photo is an optical sensor. A text complaint functions as a "human sensor," capturing subjective experiences like taste and smell, which are analogous to what an electronic nose or chemical sensor might detect. Metadata provides the contextual telemetry.
Now, let's apply this framework to your project's specific data modalities.
1. Images: The Visual Evidence
A photograph of a mid-day meal is your most direct piece of evidence. Your experience with computer vision and AI tells you that images are rich data sources, and in this context, they can provide objective, hard-to-falsify information about several key aspects of the meal.
- Variety and Composition: What food items are on the plate? An image can help you verify if the meal aligns with the official menu. For example, you can identify:
- The presence of a staple grain (rice or roti).
- The presence of a protein source (dal, sambar, egg, chickpeas).
- The presence and type of vegetables.
- Quantity: Is the portion size adequate? While you cannot get a precise weight from a 2D image without a reference object, you can make powerful relative judgments. You can assess:
- The overall amount of food relative to the plate size.
- The ratio of different components (e.g., a large serving of rice with only a tiny amount of dal is a quantity violation for the dal component).
- Visible Quality: How does the food look? Visual inspection can reveal signs of poor quality that suggest nutritional deficiencies or improper preparation.
- Consistency: Is the dal watery and thin, or thick and substantial?
- Preparation: Are rotis burnt? Is the rice lumpy or discolored?
- Freshness: Do vegetables look wilted or fresh?
- Contamination and Hygiene: An image can capture obvious foreign objects or unsanitary conditions.
- Contaminants: Insects, hair, stones, or other debris in the food.
- Hygiene: Dirty plates, unhygienic serving areas, or food served on the floor.
To better understand what to look for in these images, it helps to know what food items and infrastructure are standard.
State Survey of School Meal Programs in India 2020
This report details the typical food items and kitchen setups in the meal scheme. This information provides the "ground truth" for what you should expect to see in meal photos.
Please review two sections in this report: In Section 3.4, "Food Basket and Nutrition," look at Figure 13 and Table 8. These show the common food categories served across states. This will help you know what to identify in images. In Section 3.5, "Infrastructure," look at Figure 19 and Table 12. These describe the kitchen setups (e.g., on-site vs. centralized). This provides context for potential variations in meal quality you might observe.
Limitation: An image can't tell you everything. It can't measure the protein content in grams, confirm the presence of micronutrient fortification, or detect the taste or smell of the food. It provides a powerful but incomplete snapshot.
2. Text: The Voice of the Community
Textual data, such as complaints from parents or reports from activists collected from social media, news articles, or messaging apps, captures the evidence that images miss. Since you have a background in Natural Language Processing, you know that extracting structured information from this unstructured data is a key challenge. For now, let's focus on what information it contains.
- Invisible Quality Issues: Text is the primary source for sensory feedback.
- Taste and Smell: Complaints like "the dal was tasteless," "the milk smelled sour," or "the rice was half-cooked."
- Texture: "The rotis were hard as rock."
- Safety and Health Incidents: This is the most critical information that text can provide.
- Foodborne Illness: Reports like "20 children fell sick after eating the meal" or "my son had stomach pain and vomiting."
- Non-Visible Contamination: "We found a small piece of glass in the food," or "the rice had small stones in it."
- Systemic and Procedural Violations: Text can describe failures in the process that are impossible to capture in a single image.
- Irregularity: "They haven't served eggs for a month," or "the school was closed, and no meal was given."
- Corruption: "The headmaster takes half the rice supplies home."
- Hygiene: "The cooks don't wash their hands," or "the kitchen is infested with rats."
Limitation: Text data is subjective and can be prone to exaggeration or vagueness. A complaint of "bad food" is less useful than "the dal was watery and had no salt." Part of your task in later modules will be to design a system that can interpret and rank the severity and specificity of these complaints.
3. Metadata: The Crucial Context
Metadata is the structured information that provides context to your unstructured image and text data. It's the "who, what, when, where, and why" that transforms an isolated data point into a piece of evidence. Given your experience with data warehousing and database design, you can appreciate how vital this contextual data is for analysis.
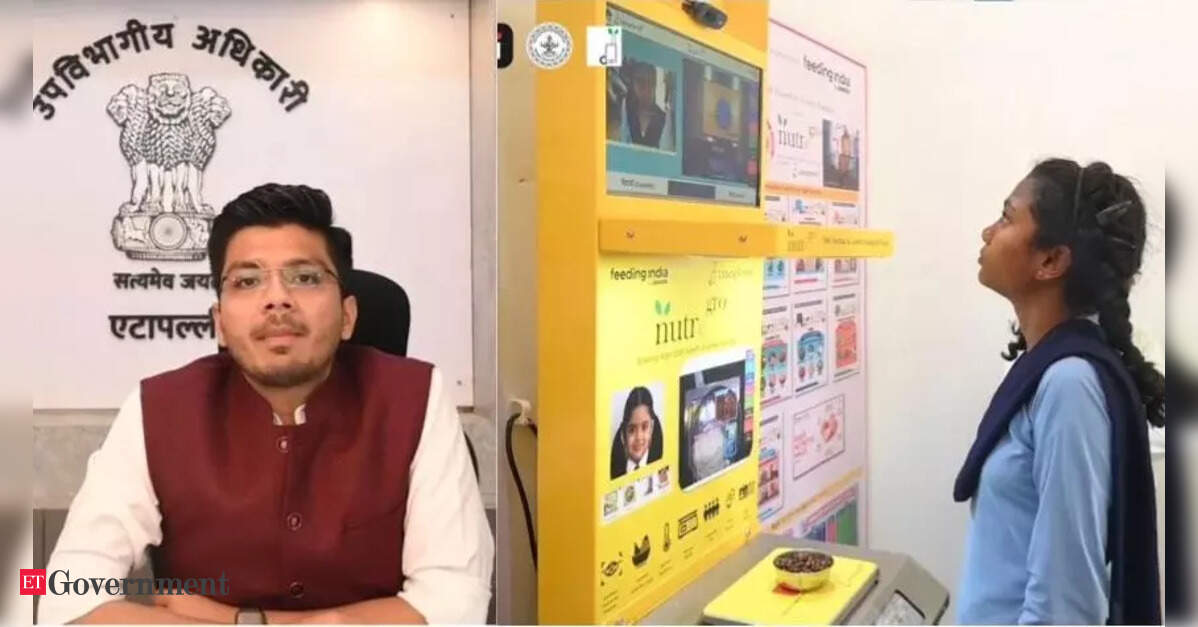
Your key metadata fields will include:
- Geospatial Data (Where): School name/ID, village, block, district, and state. This is essential for identifying geographic patterns. Is there a cluster of complaints in a particular district? Are certain regions performing worse than others?
- Temporal Data (When): Date and time of the meal/complaint. This allows for trend analysis. Does meal quality decline towards the end of the month when supplies might be low? Are there seasonal patterns, for example, during monsoon season when supply chains are disrupted?
- Categorical Data (What/Who): School type (primary, upper primary), management (government, local body, NGO), location (rural, urban). This enables comparative analysis. For instance, do NGO-run kitchens have fewer complaints than government-run ones?
This metadata is the glue that connects everything. By joining a complaint (text) with its location (geospatial) and time (temporal), you can start to uncover systemic issues rather than just looking at isolated incidents.

Tying It All Together: A Complementary System
The power of your multimodal approach comes from fusing these different data streams. Each modality compensates for the limitations of the others.
Here’s a table that maps the violation types we discussed in Lesson 2 to the signals you can expect from each data source:
| Violation Category | Primary Image Signal | Primary Text Signal | Key Metadata Signal |
|---|---|---|---|
| Nutritional Composition | Absence of a required food group (e.g., no dal, no egg). | "They only served rice and salt." | Date, Official Menu for the region. |
| Quantity | Small portion size relative to plate; low ratio of key items (e.g., dal). | "My child came home hungry." | Child's age/school level (Primary vs. Upper Primary). |
| Food Quality | Watery/thin consistency; burnt or undercooked appearance; discoloration. | Reports of bad taste, foul smell, or wrong texture. | Kitchen type (centralized vs. on-site). |
| Contamination | Visible foreign objects (insects, hair, debris). | Reports of non-visible objects (glass, stones) or chemical taste. | History of similar reports from the same school. |
| Food Safety | (Rarely visible) | Reports of illness, vomiting, or stomach pain after the meal. | Date, School ID (to detect clusters). |
| Hygiene | Dirty plates, utensils, or serving area. | "The kitchen was filthy," "cooks had unhygienic habits." | School inspection records (if available). |
| Scheme Regularity | No image available for a given day (potential indicator). | "No meal was served today." | Date, School ID. |
A photo of a full, varied meal might be contradicted by a text complaint about a foul smell. A vague text complaint about "bad food" becomes much more credible when accompanied by a photo showing a plate with just plain rice. By combining these signals, you can build a much more robust and accurate violation detection system.
Conclusion
In this lesson, you have systematically mapped your project's data sources to the specific information they can provide for detecting meal quality violations.
Key Takeaways:
- Images provide objective, visual evidence of quantity, variety, visible quality, and obvious contamination.
- Text captures subjective and procedural information that images cannot, such as taste, smell, food safety incidents, and systemic failures.
- Metadata (Geospatial, Temporal, Categorical) provides the essential context, allowing you to move from analyzing single incidents to identifying systemic patterns, trends, and hotspots.
- The strength of your project lies in the complementary nature of these modalities. Fusing them will create a more accurate and comprehensive monitoring system than any single data source could achieve.
You now have a clear understanding of both the problem domain and the data you'll use to address it. This brings us to the end of our first module. In our next lesson, we will begin Module 2: Translating Problems into ML Tasks. We will take the signals we've identified today and start to formalize them into precise, measurable definitions that can be used to train your machine learning models.