In our previous lesson, you crafted the first version of your annotation guidelines, creating a detailed instruction manual for labeling meal images and text complaints. This was a crucial step in translating your project's abstract goals into concrete, repeatable tasks. However, even the clearest guidelines can be interpreted differently by different people. What one person considers "sufficient quantity," another might see as "insufficient."
This lesson tackles that very challenge. We will explore the concept of inter-annotator reliability (IAR), which is the formal way to measure the consistency of judgments between your annotators. You will learn why this is one of the most critical health checks for your dataset and how to quantify it using standard statistical metrics. More importantly, we'll outline a concrete strategy for what to do when disagreements inevitably arise, turning them from a problem into a valuable tool for refining your ground truth.
The Problem with Inconsistency
Imagine you hire two people to label 100 meal images using your new guidelines. If they only agree on 60 of them, which 60 labels do you trust? What do you do with the other 40? If the data you use to train your model is itself a product of inconsistent human judgment, your model will learn that inconsistency. This leads to unreliable predictions and a system that fails to perform its core function. "Garbage in, garbage out" starts here, with unreliable labels.
The goal is not to achieve 100% agreement—that's often impossible for subjective tasks. The goal is to measure agreement, understand why it's not perfect, and use that understanding to improve your process.
The first step is realizing that simple percent agreement isn't enough. If 95% of meals are acceptable, two annotators who randomly guess "acceptable" most of the time will appear to have high agreement purely by chance. We need a way to correct for this.
This article by Michael Brenndoerfer is an excellent deep dive into the statistical machinery of inter-annotator agreement. It provides the right level of mathematical detail that will be useful given your quantitative background.
To begin, please read the first two sections to understand the core problem: Start with the Inter-Annotator Agreement section to grasp why this concept is fundamental to building reliable models. Next, read The Problem of Chance Agreement. This section introduces the core formula for all chance-corrected metrics and explains why raw agreement percentages can be deeply misleading. Focus on understanding the roles of observed agreement (P_o) and expected agreement by chance (P_e).
Quantifying Agreement: From Cohen's Kappa to Krippendorff's Alpha
To properly measure reliability, we use chance-corrected metrics. These statistics assess how much better your annotators' agreement is than what they would achieve by random guessing, given the distribution of labels. The three most important metrics in this family are Cohen's Kappa, Fleiss' Kappa, and Krippendorff's Alpha.
Cohen's Kappa (κ): The Standard for Two Raters
Cohen's Kappa is the classic metric for measuring agreement between two—and only two—raters. It's what you would use if you were doing a quality check by having a second expert re-label a sample of data labeled by a primary annotator.
The calculation can seem a bit complex at first, but it's built on a very intuitive foundation: creating a table to see where two raters agree and disagree, and then comparing that to the agreement you'd expect from random chance.
Cohen's Kappa (Inter-Rater-Reliability)
This short video from numiqo provides a very clear, step-by-step visual walkthrough of how Cohen's Kappa is calculated using a simple example.
Please watch the following segments to build your intuition: The introduction explains the purpose of Cohen's Kappa. The core calculation shows how to build a contingency table and use it to find the observed agreement (P_o) and expected agreement (P_e). The interpretation briefly shows how a numerical Kappa value translates into a qualitative judgment like "moderate reliability."
While the video provides a great visual, the article we looked at earlier provides the rigorous mathematical formulation and discusses its underlying assumptions.
Now, let's connect the visual intuition from the video to the formal definition.
Return to the Brenndoerfer article and read the section on Cohen's Kappa. Pay special attention to the "Properties and Assumptions." Note that Kappa assumes fixed, specific raters and that all disagreements are equally bad. This is fine for your nominal labels like protein_present vs. protein_absent, but we might need something more flexible for ordinal scales like severity.
Fleiss' Kappa and Krippendorff's Alpha (α): For Multiple Raters and Messy Data
Your project will likely involve more than two annotators, perhaps a small team or even crowdsourced workers. Cohen's Kappa doesn't work here. This is where Fleiss' Kappa and Krippendorff's Alpha come in.
- Fleiss' Kappa is an extension that works for any fixed number of raters. It assumes the raters are interchangeable, making it suitable for situations where you have a pool of annotators rather than two specific experts.
- Krippendorff's Alpha (α) is the most general and powerful of all. It can handle any number of raters, and crucially, it can handle missing data—where not every annotator labels every single item. This is extremely common in real-world projects. Alpha can also be adapted for different types of data (nominal, ordinal, etc.), making it the gold standard for complex annotation tasks.
For your project, Krippendorff's Alpha will be the most appropriate metric if you end up using a team of annotators.
This article provides an excellent comparison of these advanced metrics and includes Python code, which will be valuable for you.
Continue reading the following sections in the article: Skim the section on Fleiss' Kappa to understand its core idea of interchangeable raters. Read the section on Krippendorff's Alpha more carefully, focusing on its ability to handle missing data. This is its key advantage for practical projects. Go through the Worked Example and the accompanying Code Implementation. As someone comfortable with Python, seeing how these metrics are implemented in code will solidify your understanding. Notice how Fleiss' Kappa and Krippendorff's Alpha produce the same result for complete nominal data. Finally, read the Summary section to review the key distinctions between the three metrics.
A Strategy for Handling Disagreement
Measuring a low Kappa or Alpha score isn't the end goal; it's the starting signal. Disagreement is data. It tells you where your guidelines are ambiguous, where your task is inherently subjective, or where your annotators need more training. Your strategy for handling it should be an iterative loop of refinement.

Here is a practical, multi-step strategy for resolving disagreements and improving your data quality.
Step 1: Analyze Disagreement Patterns
Don't just look at the final IAR score. Dive into the contingency matrix (like the one in the Cohen's Kappa example). Which labels are most often confused for each other? For instance, do annotators frequently disagree on quantity_sufficient vs. quantity_insufficient? Or quality_poor_preparation vs. quality_bad_taste_smell in the text data? This analysis points you directly to the weakest parts of your guidelines.
Step 2: Choose a Resolution Method
Once you have your labels for a data point, you need a single "gold" label for model training. Here are the common approaches:
- Adjudication: A senior annotator or domain expert (in this case, you) reviews every item where there was a disagreement and makes the final decision. This is high-quality but time-consuming.
- Majority Vote: If three or more annotators label an item, you simply take the majority label. This is fast and democratic but can be wrong if the "crowd" is mistaken, and it loses the nuance of close calls.
- Collaborative Resolution: The annotators who disagreed on an item meet to discuss the case and come to a consensus. This is an excellent way to train annotators and uncover deep ambiguities in the guidelines.
Labeling Data for Machine Learning: Best Practices and Quality Control
This blog post from Sapien.io offers a concise overview of practical strategies for resolving disagreements.
Please read the sections titled Strategies for Resolving Disagreements and Establishing IAA Thresholds. This will give you a quick summary of your options and common benchmarks.
Step 3: Refine the Guidelines
This is the most crucial step. Use the insights from your disagreement analysis to make your guidelines more explicit.
- If annotators disagree on quantity, add more visual examples to your guidelines: "This is what
quantity_sufficientlooks like," and "This is whatquantity_insufficientlooks like." - If they confuse two text labels, add a "distinction" section: "Label as
poor_preparationif the complaint is about the cooking process (burnt, oily). Label asbad_taste_smellonly if the complaint explicitly mentions taste or odor."
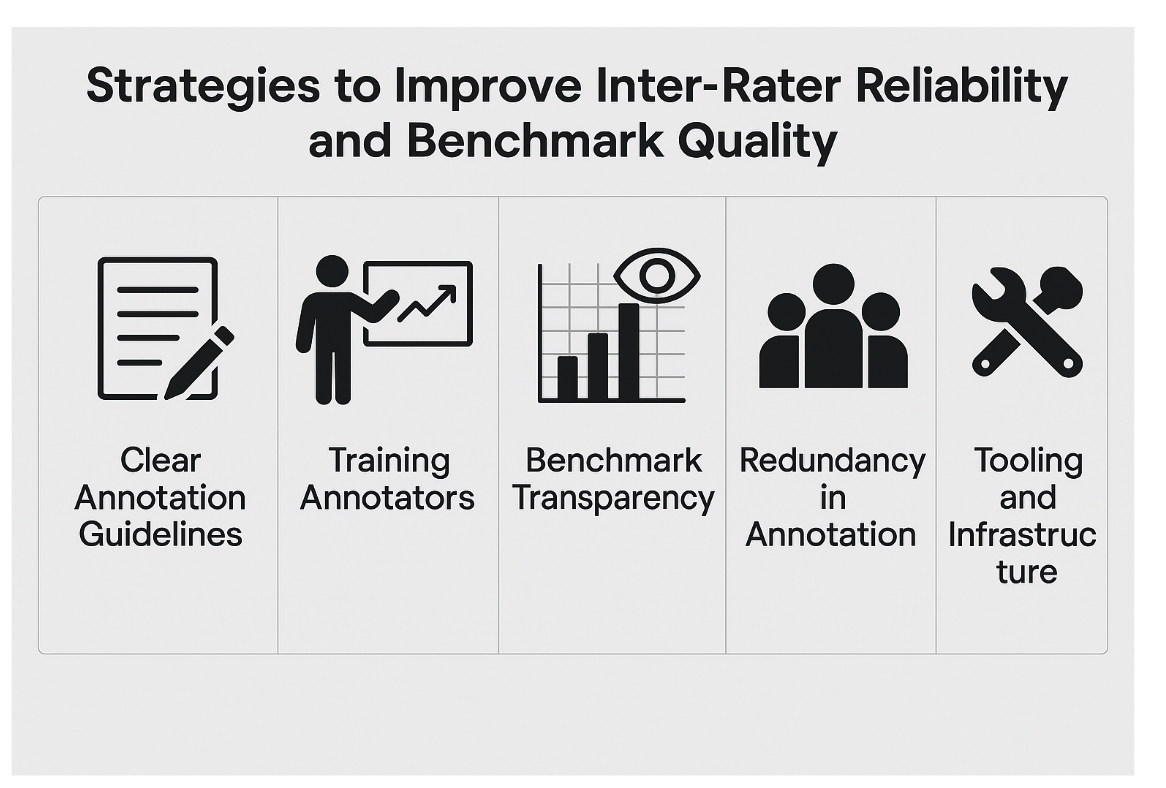
This iterative cycle—annotate, measure, resolve, refine—is the engine of data quality.
Conclusion
In this lesson, we moved from drafting guidelines to establishing a process for ensuring they work. You learned that creating reliable ground truth is a scientific process of measurement and refinement, not a one-time task.
Key Takeaways:
- Inter-Annotator Reliability (IAR) is a critical measure of the consistency and objectivity of your labeled data.
- Simple percentage agreement is misleading. Always use a chance-corrected metric like Cohen's Kappa (for two raters) or Krippendorff's Alpha (for multiple raters and messy, real-world data).
- Low IAR is not a failure but a signal for improvement. It reveals ambiguities in your annotation guidelines that must be addressed.
- A robust disagreement resolution strategy involves analyzing disagreement patterns, choosing a method like adjudication or majority vote to create a final label, and, most importantly, feeding the insights back into refining your guidelines.
You now have the theoretical tools to measure the quality of your annotation process. In the next lesson, we will put this theory into practice by planning a small pilot annotation exercise. You'll select a small batch of your data, prepare it for annotation, and design a workflow to test your guidelines and calculate your first IAR score.