Introduction
In our last lesson, we established the "skeleton" of our model by building a dynamic timeline with flags to distinguish between historical and forecast periods. This was a crucial first step in creating a flexible and automated model. Now, we'll build upon that foundation by constructing the model's "central nervous system": a dedicated controls sheet.
This lesson focuses on creating flags and switches for robust scenario toggling. Instead of manually changing inputs or—even worse—maintaining separate files for different cases, you will learn to build a single, elegant mechanism to switch between base, upside, and downside scenarios. This practice is not just a cornerstone of professional financial modeling and a key competency for the AFM exam; it also mirrors the principles of parameterization you've used in data modeling and A/B testing, where a single change can trigger a cascade of controlled, predictable outcomes.
By the end of this lesson, you will be able to construct a centralized controls sheet that allows any user to dynamically switch between multiple scenarios, making your model a powerful tool for decision-making and risk analysis.
Why a Centralized Control System is Non-Negotiable
Before we dive into the mechanics, it's vital to understand the problems we're solving. Inexperienced modelers often fall into two traps when handling different scenarios, both of which are inefficient and highly error-prone.
Creating Scenarios in an Excel Financial Model
This article from Pivotal180 clearly articulates the common pitfalls of managing scenarios in financial models.
Please read the introductory section, from the beginning of the discussion until the end of the paragraph explaining the two flawed approaches. As you read, reflect on how these issues—version control nightmares and the risk of not reverting manual changes—are analogous to problems in managing different versions of code or analytics dashboards.
As the article explains, both creating separate files and manually changing inputs lead to inconsistencies and significant rework. The professional standard, which we will build now, is to house all scenario logic within a single, auditable model structure.
Step 1: Building the User Interface for Scenarios
The first step is to create a user-friendly switch on our controls sheet. This switch will be the single point of interaction for the user to select a scenario. There are two primary methods in Excel to achieve this: a Combo Box and a Data Validation list. For your AFM exam preparation, the Combo Box is generally preferred as it is visually distinct and its underlying logic is slightly cleaner.
The Financial Modeling Institute (FMI) provides a concise guide on creating both.
How to Create a Scenario Switch in Excel - FMI
This FMI guide provides a clear, step-by-step walkthrough of how to create the two main types of scenario switches.
First, read the introduction to understand the purpose of the switch. Then, carefully follow the steps in the section describing the Combo Box. This is the primary method we will use. Afterward, read the next section on using Data Validation. Pay close attention to the two reasons the author gives for being cautious with this method for scenarios. This will help you understand the subtle but important distinctions in best practices.
To summarize, the Combo Box is linked to a cell that outputs a number (e.g., 1 for Base, 2 for Upside, 3 for Downside). This numerical index is what we will use to drive the model's logic. A Data Validation list, while also creating a dropdown, populates the cell with text (e.g., "Base Case"), which requires an extra step or a different formula structure.
Step 2: Creating the Scenario Logic Engine
With a switch that outputs a 1, 2, or 3, we now need to build the engine that uses this number to select the correct set of assumptions. The standard approach involves three components:
- Scenario Matrix: A table on your controls sheet where you lay out the assumptions for each scenario in separate columns (e.g., a column for Base Case, one for Upside, one for Downside).
- Live Scenario Column: A single column that represents the currently active assumptions being used by the model.
- The Formula: A function that populates the "Live" column by picking the correct value from the scenario matrix based on the switch's output.
We have two excellent choices for this formula: CHOOSE and INDEX.
The CHOOSE Function: Simple and Direct
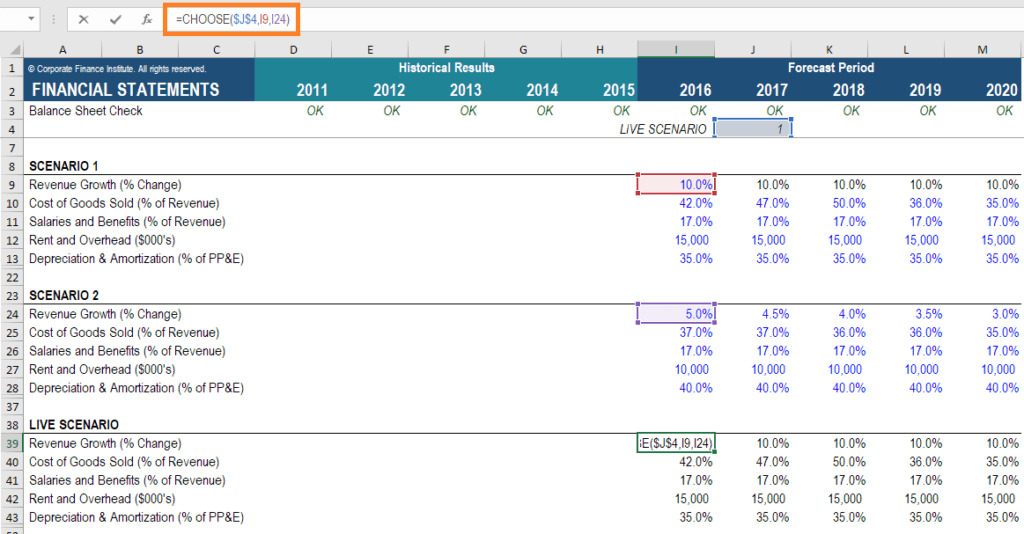
The CHOOSE function is perfect for when you have a small, fixed number of scenarios (e.g., 2 to 5). Its syntax is very intuitive: CHOOSE(index_number, value1, [value2], ...).
The following video from the Corporate Finance Institute provides a crisp demonstration of setting this up.
Scenario Analysis in Excel: Financial Modeling
This video clearly walks through setting up a scenario manager using the CHOOSE function.
Watch the entire video. Pay close attention to these key segments: Setting up the assumption blocks: Notice how the assumption sets for each scenario are laid out identically. Creating the switch: This shows the creation of the numerical switch cell that will drive the logic. Implementing the CHOOSE function: This is the core of the lesson. Observe how the formula is constructed to reference the switch and the different scenario values.
As you saw, the CHOOSE function takes the number from your switch (e.g., J4 in the video) and selects the corresponding argument from the list.
The INDEX Function: Scalable and Robust
For more complex models or those with many scenarios, the INDEX function is often more scalable and robust than nested IF statements or even CHOOSE. The logic is INDEX(array, row_num, [column_num]). In our case, we provide the array of scenario assumptions (e.g., a row containing the revenue growth for all three cases) and tell it to pick from the column number provided by our scenario switch.
The Pivotal180 article you read earlier provides an excellent walkthrough of this method.
Creating Scenarios in an Excel Financial Model
This section of the Pivotal180 article provides a detailed demonstration of using the INDEX function for scenario management.
Please read the section that begins with the simple example and continues through the detailed explanation of the INDEX function. Focus on how the INDEX function uses the "case selector cell" as its column_num argument to retrieve the correct assumption from the array of choices.
The core advantage of INDEX is that your assumptions for all scenarios are contained within a single range (E7:G7 in the article's example), which can be easier to manage and expand than the individual arguments required by CHOOSE.
Step 3: Integrating Everything on a Controls Sheet
A best-practice model consolidates all of these elements onto a single "Controls," "Master," or "Timing" sheet. This sheet becomes the command center for the entire model.

Your controls sheet should be structured to include:
- Timeline Controls: The
Model Start Date,Forecast Start Date, etc., from our previous lesson. - Timeline & Period Flags: The rows of 1s and 0s that define historical, forecast, operational, and other periods.
- Scenario Selector: The Combo Box dropdown you created.
- Scenario Input Matrix: The table holding the assumptions for your Base, Upside, and Downside cases.
- Live Assumptions: The single column of active assumptions, driven by your
CHOOSEorINDEXformulas, that the rest of your model links to.
This enforces a clean separation of inputs (the scenario matrix) from calculations (the rest of the model), linked dynamically via the controls sheet.
Conclusion
In this lesson, we have built a powerful and flexible scenario analysis framework, a hallmark of any professional-grade financial model. By centralizing your assumptions and using a simple switch, you've made your model more dynamic, auditable, and user-friendly.
Here are the key takeaways:
- Centralize Control: All key drivers and switches belong on a dedicated controls sheet to avoid error-prone manual changes or versioning issues.
- Use a Clean UI: A Combo Box (Form Control) is the FMI-preferred method for creating a user-facing scenario switch that outputs a numerical index.
- Separate Scenarios from Live Logic: Lay out your assumptions in a matrix (e.g., columns for Base, Upside, Downside) and use a "Live" column to feed the rest of the model.
- Leverage
CHOOSEorINDEX: Use theCHOOSEfunction for simple, direct scenario selection or theINDEXfunction for a more scalable and robust alternative.
We have now established the model's core architecture: a dynamic timeline and a robust control system. The next logical step is to start populating this structure with data. In our next lesson, we will begin Module 2 by focusing on how to extract and restructure raw historical data from financial statements into a clean, model-ready format that can be integrated into the "Actuals" period of our timeline.