Hello. This course begins by making the word crash more precise. In this module, you will first learn to describe a decline, then examine why prices move and why selling can have a larger effect when trading is difficult. Today’s task is classification: separate how far prices fell, how fast they fell, and how widely the decline spread. Those are different facts, even when a headline compresses them into one alarming word.
Start with the move, not the label
A steep decline can feel extraordinary without meeting a conventional threshold. In Stock Market Corrections: Why Markets Stumble, The Plain Bagel contrasts two short declines in 2018. Watch for the difference between the size of a move over a few days and the size of a decline measured from a recent high.
Stock Market Corrections: Why Markets Stumble
In “Stock Market Corrections: Why Markets Stumble,” The Plain Bagel uses two 2018 declines to introduce the language of market pullbacks.
Watch the two declines for their different magnitudes and time spans. Then watch the correction definition, focusing on its reference to a recent peak rather than simply the previous trading day.
The video describes an approximately decline over a couple of days and a separate approximately decline over two weeks. Both were rapid and consequential. Only the latter reaches the commonly used correction threshold. A dramatic dollar amount lost across the market does not change that percentage calculation: the dollar total depends partly on how large the market was to begin with.
Before attaching any label, specify the object and the interval. “A share fell today,” “a broad index fell from its recent peak,” and “most shares fell together” describe different observations. The second provides the usual basis for correction and bear-market thresholds; the third helps establish whether a sell-off is broadly shared.
FINRA’s vocabulary guide supplies the conventional magnitude labels. Its definitions are useful starting points, not a complete test for whether an event deserves the word crash.
Key Terms for Tough Times: The Vocabulary of Stressed Markets | FINRA.org
Read FINRA’s “Key Terms for Tough Times” for its definitions of a bear market and a correction.
Under the page title, begin with the introductory paragraph starting “When financial markets experience turbulence.” Read the bold-labeled entries “Bear Market,” “Bubble,” and “Correction,” stopping at the end of the “Correction” entry, which says that the term is usually used for a drop in prices. The opening definitions give context for the two thresholds. Focus on FINRA’s use of a broad market index for a bear market; the intervening “Bubble” entry is not needed for today’s classification.
In ordinary market commentary, a correction is generally a decline of at least from a recent peak. A bear market generally denotes a decline of at least in a broad market index, usually with a sense of a sustained downturn. FINRA also describes a correction as a reversal before the previous trend resumes. That eventual resumption cannot be known while prices are still falling, so commentators often use correction provisionally for a decline in the -to-under- range.
Neither threshold is a physical boundary at which market behavior suddenly changes. They are conventions that help people describe magnitude. Sources also vary in how much persistence they expect before calling a drop a bear market. When duration is uncertain, “a bear-market-sized decline” states the measurable fact without claiming that a prolonged bear market has already been established.
Magnitude: measure from a stated reference point
For a decline from a recent index peak, the percentage drawdown is
Suppose an index peaked at , closed yesterday at , and now stands at . Its decline from the recent peak is
That is correction-sized. Its decline since yesterday’s close is only about . Both statements are true; they answer different questions. If a headline says an index “entered correction territory” after a modest down day, the missing context may be earlier losses since its peak.
The reference point matters just as much when a market rebounds. Imagine that an index fell from to , then recovered to . At , it is below the old peak; its maximum decline during that episode was . “Currently down ” and “experienced a correction” can both be accurate if their time references are explicit. Neither requires pretending the low never happened.
Speed is a separate measurement. State the elapsed time between the chosen starting level and ending level: one trading session, several days, or many months. A loss in two sessions is a different event from a loss over six months, although both pass the same magnitude threshold. Also distinguish an intraday low from a closing value. An index might briefly cross a threshold during trading and finish the day above it; an account based on closing levels could therefore differ from an account based on intraday prices.
These choices are not technicalities used to obscure a decline. They make descriptions comparable. For any reported move, keep the index or share, the starting level, the ending level, and the time window together.
Breadth: determine what actually fell
A broad market index summarizes many shares, but it does not tell the entire breadth story on its own. An index can fall because losses are widespread, or because a small number of heavily weighted companies have fallen sharply. To assess breadth, look for evidence about the share of constituents declining, whether losses occur across multiple sectors, and whether other broad indexes are also falling. No single constituent-count threshold defines a crash.
This distinction prevents two common mistakes. First, a company’s share price can plunge in a day while the wider market barely moves. It may be reasonable to call that a stock crash, but not a stock market crash. Second, an index can cross the correction threshold even if its losses are concentrated in a few influential shares. The index has experienced a correction-sized decline; a claim that investors are selling shares across the whole market needs additional evidence.
Breadth, speed, and magnitude can now be kept apart:
| Dimension | What to report | What it does not establish alone |
|---|---|---|
| Magnitude | Percentage fall from a stated peak or starting value | How abruptly the fall occurred |
| Speed | The time taken for that fall | How many shares participated |
| Breadth | Whether losses spread across constituents, sectors, or indexes | Whether the fall reached or |
A crash usually conveys an abrupt, severe sell-off, particularly one affecting the broader market. Unlike correction and bear market, however, it has no universally accepted percentage or time cutoff. One observer might call a sudden single-digit market drop a crash; another might reserve the term for a larger collapse. Describe the three dimensions first, then use crash as a characterization rather than as if it were a formally certified threshold.
Classify declines without forcing one exclusive label
The following cases use an index level of as a recent peak unless otherwise stated. Each description deliberately keeps the time window and breadth beside the percentage. The classifications are not competing boxes: an event can meet a magnitude threshold and plausibly be called a crash.
| Observed decline | Classification and reasoning |
|---|---|
| A broad index falls from to in two trading days; most shares fall. | Down : a fast, broad sell-off below correction magnitude. Its abruptness matters, but the threshold has not been reached. |
| A broad index falls from to in two trading days; losses span most sectors. | Down : correction-sized and plausibly a market crash, because the substantial decline was both abrupt and broad. |
| A broad index falls from to over eight months, with widespread losses. | Down : a bear-market-sized, sustained decline. Its size alone does not make the entire eight-month descent a sudden crash, although a sharp crash could have occurred within it. |
| A broad index falls from to in one session, with losses across the market. | Down : clearly crash-like in speed and breadth, and beyond the conventional bear-market magnitude threshold. One day alone does not tell you how long the downturn will last. |
| One company’s share falls from to in a day while a broad index moves little. | Down for that individual share. This may be called a stock crash, not a broad market correction, bear market, or crash. |
| A weighted index falls from to over several weeks, largely because a few influential shares fall while most members are stable. | The index is down , meeting correction magnitude. The limited breadth weakens any claim that the whole market crashed. |
Notice how a one-day decline can carry more than one description. Crash describes the character of the event, while bear-market-sized describes the size of its drawdown. Conversely, a prolonged decline can meet the bear-market convention without having the abruptness suggested by crash. The terms need not be treated as rungs on a single ladder.
A historical chart shows why the time window matters
The Dow Jones Industrial Average chart below spans several decades. It makes one distinction visible: the sharp break around 1929 was followed by a much longer fall into the early 1930s. Calling that entire downward stretch “the 1929 crash” would blur the abrupt event with the protracted decline that followed it.
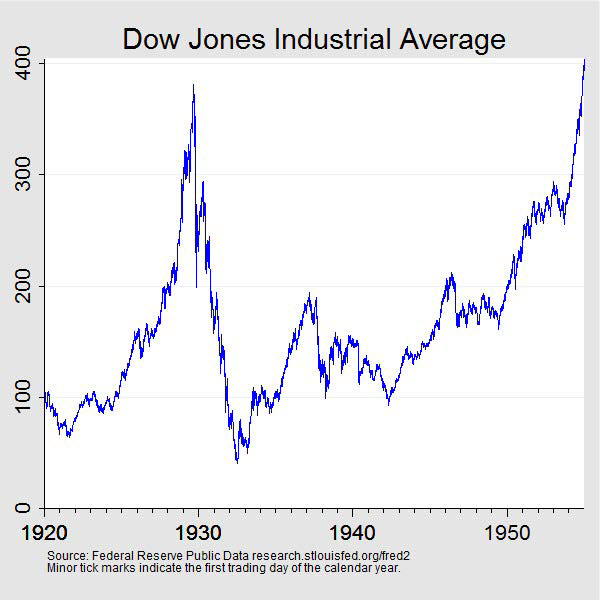
The chart also shows why a low point and a recovery point need dates attached. The index did not regain its late-1920s high quickly. Yet the line alone cannot explain why prices moved, establish the breadth of selling on a particular day, or show whether an investor’s total return recovered at the same time as the plotted index level. For today, its value is narrower and important: an abrupt crash and a long bear-market decline can be connected without being the same time interval.
Key takeaways
To classify a decline, identify what fell, calculate how far from which starting point, specify how long it took, and check how widespread it was. A decline of roughly from a recent peak reaches conventional correction magnitude; a broad-index decline of roughly reaches conventional bear-market magnitude. Crash has no comparable universal cutoff and emphasizes an unusually abrupt, severe fall, especially across the market.
This descriptive framework leaves a deeper issue open: prices can fall even when a company’s current earnings have not changed. The next lesson examines how expectations about future earnings, risk, and other investors’ actions can move share prices before the underlying business reports anything new.