The previous lesson distinguished policies that can ease funding stress, lower borrowing costs, or support lost income. None can guarantee where stock prices go next. That uncertainty matters when you encounter a warning that a crash is “coming.”
This final lesson separates two claims that often appear together: a market is vulnerable to a severe decline and a severe decline will occur within a specified period. You will learn to evaluate the second claim by checking its horizon, its definition of a crash, its false alarms, and whether its apparent success survives a test on later data.
A mechanism is not a clock
The course has traced several ways selling pressure can intensify: leveraged owners may face margin calls, urgent sellers may encounter thin order books, and falling prices may change other investors’ expectations. A warning that identifies these conditions can explain why a shock might have unusually large effects. It does not thereby identify the shock or its date.
The Federal Reserve draws a useful distinction between shocks, which are often surprises, and vulnerabilities, which can accumulate over time. Read its short account of that distinction, including its examples of elevated valuations and excessive borrowing.
Financial Stability Report | Federal Reserve
The Federal Reserve’s Financial Stability Report provides a framework for distinguishing conditions that can amplify trouble from the event that sets trouble in motion.
In the introductory discussion of its monitoring framework, find the paragraph beginning “Consistent with this view of financial stability.” Read the framework through the end of numbered category 2, “Excessive borrowing.” Focus on why monitoring a vulnerability is different from predicting when a shock will arrive.
Suppose a commentator observes substantial borrowing against stocks and argues that a fall could trigger forced sales. That is a conditional explanation: if prices fall far enough, leverage may amplify the decline. It may be worth taking seriously even if no crash follows this year. The stronger statement, “a crash will occur by year-end,” needs separate evidence about timing.
Nor does correctly anticipating a weak economy automatically settle the timing of a stock crash. Share prices reflect expectations about the future; they can fall before bad economic figures arrive or rise while published figures remain poor, if the news is better than investors had expected.
The Stock Market vs. The Economy
In “The Stock Market vs. The Economy,” Ben Felix explains why a forecast about economic conditions is not automatically a forecast about subsequent share prices.
Watch future expectations, then surprises and timing. The latter passage uses the 2009 market recovery and an example involving yield-curve inversions to separate economic forecasting from equity-market timing. Focus on what investors may already have anticipated when new information arrives.
Make the warning capable of being wrong
“A crash is inevitable because valuations are high” sounds precise but leaves crucial terms open. A decline next month, a bear market three years from now, and a sharp one-week sell-off could all be claimed as vindication after the fact. To assess a forecast, its terms must be fixed before the outcome is known.
A testable warning needs a named market measure, an event definition, and a forecast horizon. For example:
“From the date of this warning, a named broad stock index will record a decline of at least 20% from a closing peak to a later closing trough within no more than 30 trading days, at some point in the next 12 months.”
This is an illustrative test rule, not a universal definition of crash. The 20% figure is commonly associated with a bear market; adding the 30-trading-day limit makes speed part of this particular test. The index, date, prices used, and 12-month deadline must be recorded in advance. If a 15% fall occurs, or a 20% fall occurs only after the deadline, this forecast has not met its stated rule—even if the underlying concern about leverage was sensible.
The horizon changes both the meaning and usefulness of a warning. “Within three years” gives an event much more time to occur than “next month,” but supplies less guidance about when to act. A signal can be early enough to help people reduce a vulnerability without being precise enough to time a stock-market exit.
A Bank for International Settlements (BIS) study of banking-crisis indicators makes this distinction explicit. Its findings are not evidence that the same indicators predict stock crashes; the valuable point here is its method for judging warnings.
Early warning indicators of banking crises: expanding the family
This BIS study explains how analysts weigh missed events against false alarms, and why an indicator that detects a buildup of risk need not pinpoint a crisis date.
In “Evaluating EWIs,” begin at “When formally evaluating the performance of the EWIs.” Read the evaluation discussion through the paragraph explaining the study’s 12-quarter forecast horizon. Focus on the trade-off between detecting more crises and issuing more false alarms, and on the distinction between a multi-year risk signal and precise timing.
Count the alarms that did not lead to crashes
A warning’s celebrated successes are only part of its record. An evaluation must also count false alarms—warnings with no event inside the stated horizon—and misses—events that arrived without a warning.
Consider a hypothetical indicator assessed across 20 separate annual forecast periods. Its crash definition and 12-month horizon were fixed in advance. Two periods contained a crash. The indicator warned in four periods: once before a crash and three times when no crash followed.
| Outcome | Crash in the period | No crash in the period |
|---|---|---|
| Warning issued | 1 correct warning | 3 false alarms |
| No warning | 1 missed crash | 15 correct non-warnings |
The indicator detected 1 of 2 crashes, while 3 of its 4 warnings were false alarms. Equivalently, a crash followed 1 of 4 warnings. These statements answer different questions. “Half the crashes were preceded by a warning” does not mean “a warning gives a 50% chance of a crash.” Here, only 25% of warnings preceded one. With just two crashes, neither figure is a dependable estimate of future performance.
The BIS study cautions against exactly that confusion. Its example concerns banking crises, but the distinction between the share of events detected and the share of warnings followed by an event applies to any specified crash-warning test.
Early warning indicators of banking crises: expanding the family
Box B of the BIS study shows how a seemingly impressive detection rate can coexist with warnings that often do not lead to crises.
Go to “Box B: What do EWIs tell us?” on pp. 42–43, after the large table. Starting at “This box explains how to read the table,” read the interpretation through the comparison between the percentage of crises preceded by signals and the percentage of signals followed by crises. Note its rule for counting a signal as a false alarm when no crisis occurs inside its stated three-year horizon.
A receiver operating characteristic, or ROC, curve displays another aspect of the same record. For different settings of a warning threshold, its vertical axis gives the share of actual events detected, while its horizontal axis gives the share of non-event periods incorrectly flagged. A threshold that issues warnings more readily may catch more events but also flag more ordinary periods. The false-positive rate on this chart is not the fraction of warnings that turn out false; the latter also depends on how often the event occurs at all.
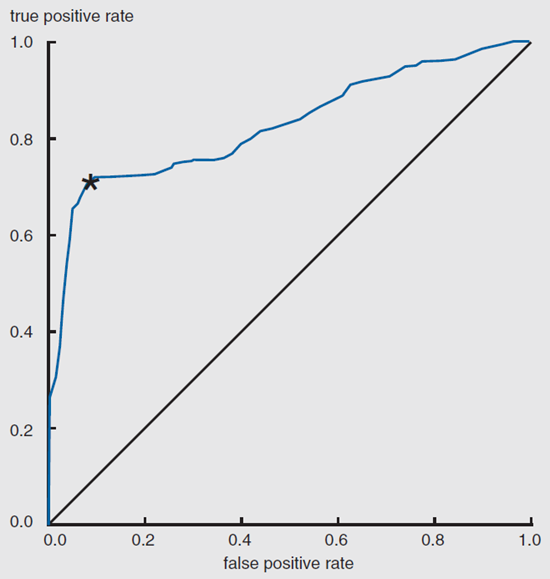
Even a signal that distinguishes risky from ordinary periods better than chance may produce many false alarms when the event being predicted is rare. A compelling chart therefore cannot replace the plain-language record: how many warnings were issued, how many were followed by the specified event within the specified horizon, and how many events were missed.
Test the claim on information not used to create it
An indicator can look persuasive when its author chooses its threshold after seeing which past values preceded crashes. That is useful for developing a hypothesis, but a good fit to those same episodes is not a fair test of forecasting ability. Trying many indicators, thresholds, crash definitions, and horizons before reporting only the best-looking combination makes accidental success more likely.
Out-of-sample evidence tests a fixed rule on observations that were not used to design or tune it. The strongest practical version records predictions as they are made, using only data available at the time, then scores them when their deadlines pass. A historical test can also reserve later periods for evaluation, provided the rule was fixed without consulting those periods.
Return to the hypothetical indicator. Its 20-period record showed one correct warning and three false alarms. Suppose its rule is then frozen and assessed over ten later annual periods. If it warns three times, none of those periods contains a crash, and the one crash occurs without a warning, its later record is three false alarms and one miss. That invented example does not prove the indicator can never help; ten periods, including only one crash, are too few for such a conclusion. It does show why the earlier success cannot simply be advertised as established forecasting skill.
For a real warning, check that its reported results:
- use the same crash definition, horizon, and warning rule for successes and failures;
- include every eligible warning, rather than a selection of memorable calls;
- use information that was available when each warning was issued; and
- report performance on later or otherwise held-out observations, not just the data used to choose the rule.
There is a further distinction between assessing a signal and interpreting every false alarm. A vulnerability might subside, or preventive action might reduce the danger it identified. Such possibilities matter when explaining the outcome, but they cannot silently turn a missed, pre-specified forecast into a successful one. The proper conclusion may be “this identified a real vulnerability, but did not reliably forecast a crash within the claimed horizon.”
An evidence-based verdict
A useful verdict separates mechanism, forecast, and evidence. Consider a warning that describes high leverage and thin trading liquidity, then declares that a broad stock index will crash within 12 months. The amplification mechanism is plausible in light of what this course has covered. The timing claim is a different matter: it needs a fixed event definition, a complete record of expired warnings and missed crashes, and evidence that the rule works beyond the episodes used to devise it.
When those elements are absent, the warranted conclusion is neither “a crash is certain” nor “there is no risk.” It is narrower: the warning may explain vulnerability, but it has not demonstrated reliable timing ability. That distinction lets you learn from a credible account of how losses could cascade without treating an asserted date as knowledge.
Key takeaways
A crash warning earns forecasting credibility through pre-specified, testable claims: a defined market event and an explicit horizon. Judge its whole record, including false alarms and missed crashes, and distinguish the share of crashes it detected from the share of warnings that actually preceded crashes. Then look for performance on data that did not shape the rule.
Across the course, the central distinction has been between understanding a market’s capacity to amplify a shock and knowing exactly when that shock—or a crash—will occur. The first can inform preparation. It does not establish the second.