Hello! In our last lesson, we concluded our deep dive into Azure API Management by looking at how to use policies for performance enhancement and data transformation. You learned to implement caching to speed up responses and reduce backend load, and to use transformation policies to modernize legacy services and create cleaner API facades.
Today, we're shifting our focus from managing to observing. We'll begin the final module of this course, "Monitoring and Troubleshooting Azure Solutions." A core principle of modern DevOps and cloud engineering is observability—the ability to understand the internal state of your system from the outside. Without it, you're flying blind.
This lesson directly addresses the first step in achieving observability for your web apps: Enable and configure Application Insights for an Azure App Service application. We'll explore what Application Insights is and the easiest ways to integrate it with your .NET applications hosted on App Service.
1. What is Application Insights?
Before we enable it, let's understand what Application Insights does. It's a feature of Azure Monitor and is a powerful Application Performance Management (APM) service. It's designed to help you monitor your live web applications, automatically detecting performance anomalies and providing rich analytics tools to help you diagnose issues and understand what users are actually doing with your app.
To get a solid overview of its capabilities, let's watch a short introductory video.
Azure Application Insights Tutorial | Amazing telemetry service
This video from Adam Marczak provides an excellent high-level summary of what Application Insights is, how it fits into a typical application architecture, and the kinds of data—or telemetry—it collects.
Watch the first section, from the beginning until the overview. Pay close attention to the types of telemetry mentioned, such as request rates, dependency calls, and especially exceptions.
As the video explained, Application Insights automatically collects telemetry on:
- Request rates, response times, and failure rates: How is your API performing?
- Dependency rates, response times, and failure rates: Is your app's performance being affected by external services like databases or other APIs?
- Exceptions: Both server-side and client-side exceptions are captured with full stack traces.
- Page views and load performance: How are users interacting with the front end?
- Host diagnostics: CPU, memory, and I/O usage.
Now, let's see how to get this powerful tool working for our App Service.
2. Enabling Application Insights: The "Codeless" Approach
For many application stacks running on Azure services like App Service, Microsoft provides a method called autoinstrumentation. As the name suggests, it enables monitoring automatically without you needing to modify your application's code.
Autoinstrumentation for Azure Monitor Application Insights
This Microsoft Learn article defines autoinstrumentation and lists its primary advantages.
Read the introduction and the section "What are the autoinstrumentation advantages?". This will clarify why this is often the preferred starting point for monitoring.
The main benefit is its simplicity. You can add comprehensive monitoring to an already deployed application with just a few clicks. There are two primary scenarios for this codeless enablement.
Scenario 1: Enabling for an Existing App Service
If you have an App Service already running, you can enable Application Insights directly from its configuration blade in the Azure portal.
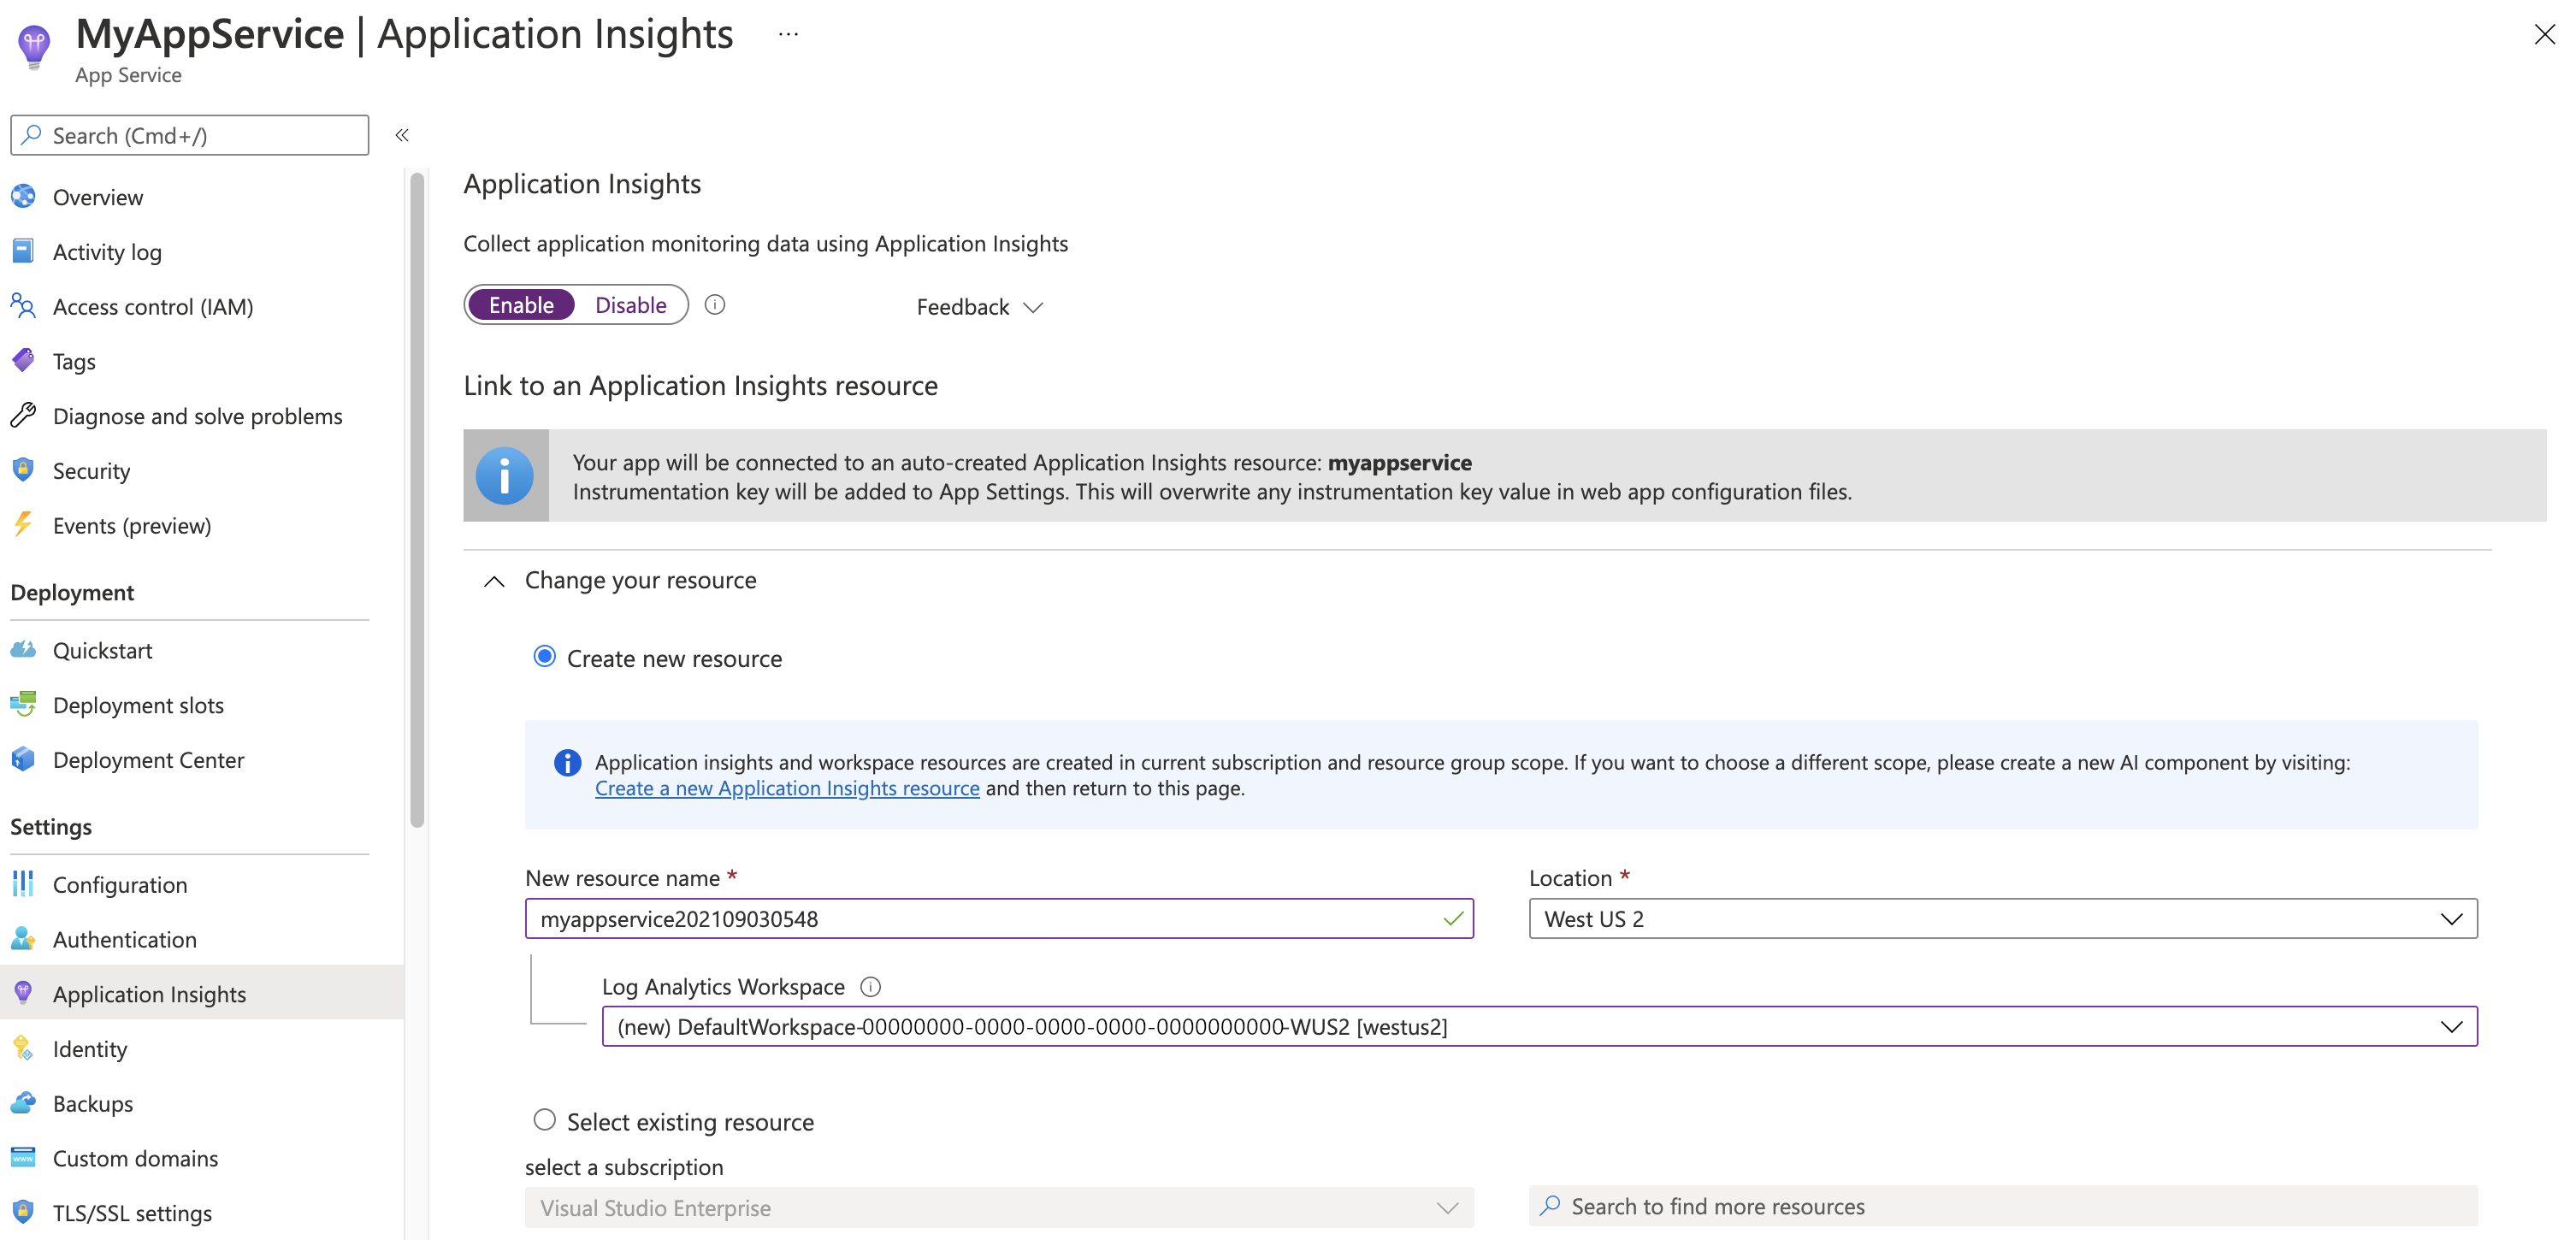
This next video demonstrates this exact process.
Setting Up Azure Application Insights | Configuring in .NET Core Web API | Step-by-Step Guide | LSC
The "Learn Smart Coding" channel shows how to navigate to an existing App Service and enable Application Insights after the fact.
Watch the segment from configuring insights to see the process in action.
When you click "Enable" and "Apply," Azure does two things:
- It provisions a new Application Insights resource (or links to an existing one).
- It automatically adds Application Settings to your App Service configuration to link it to the new resource.
These settings act as environment variables for your application. The most important one is APPLICATIONINSIGHTS_CONNECTION_STRING.
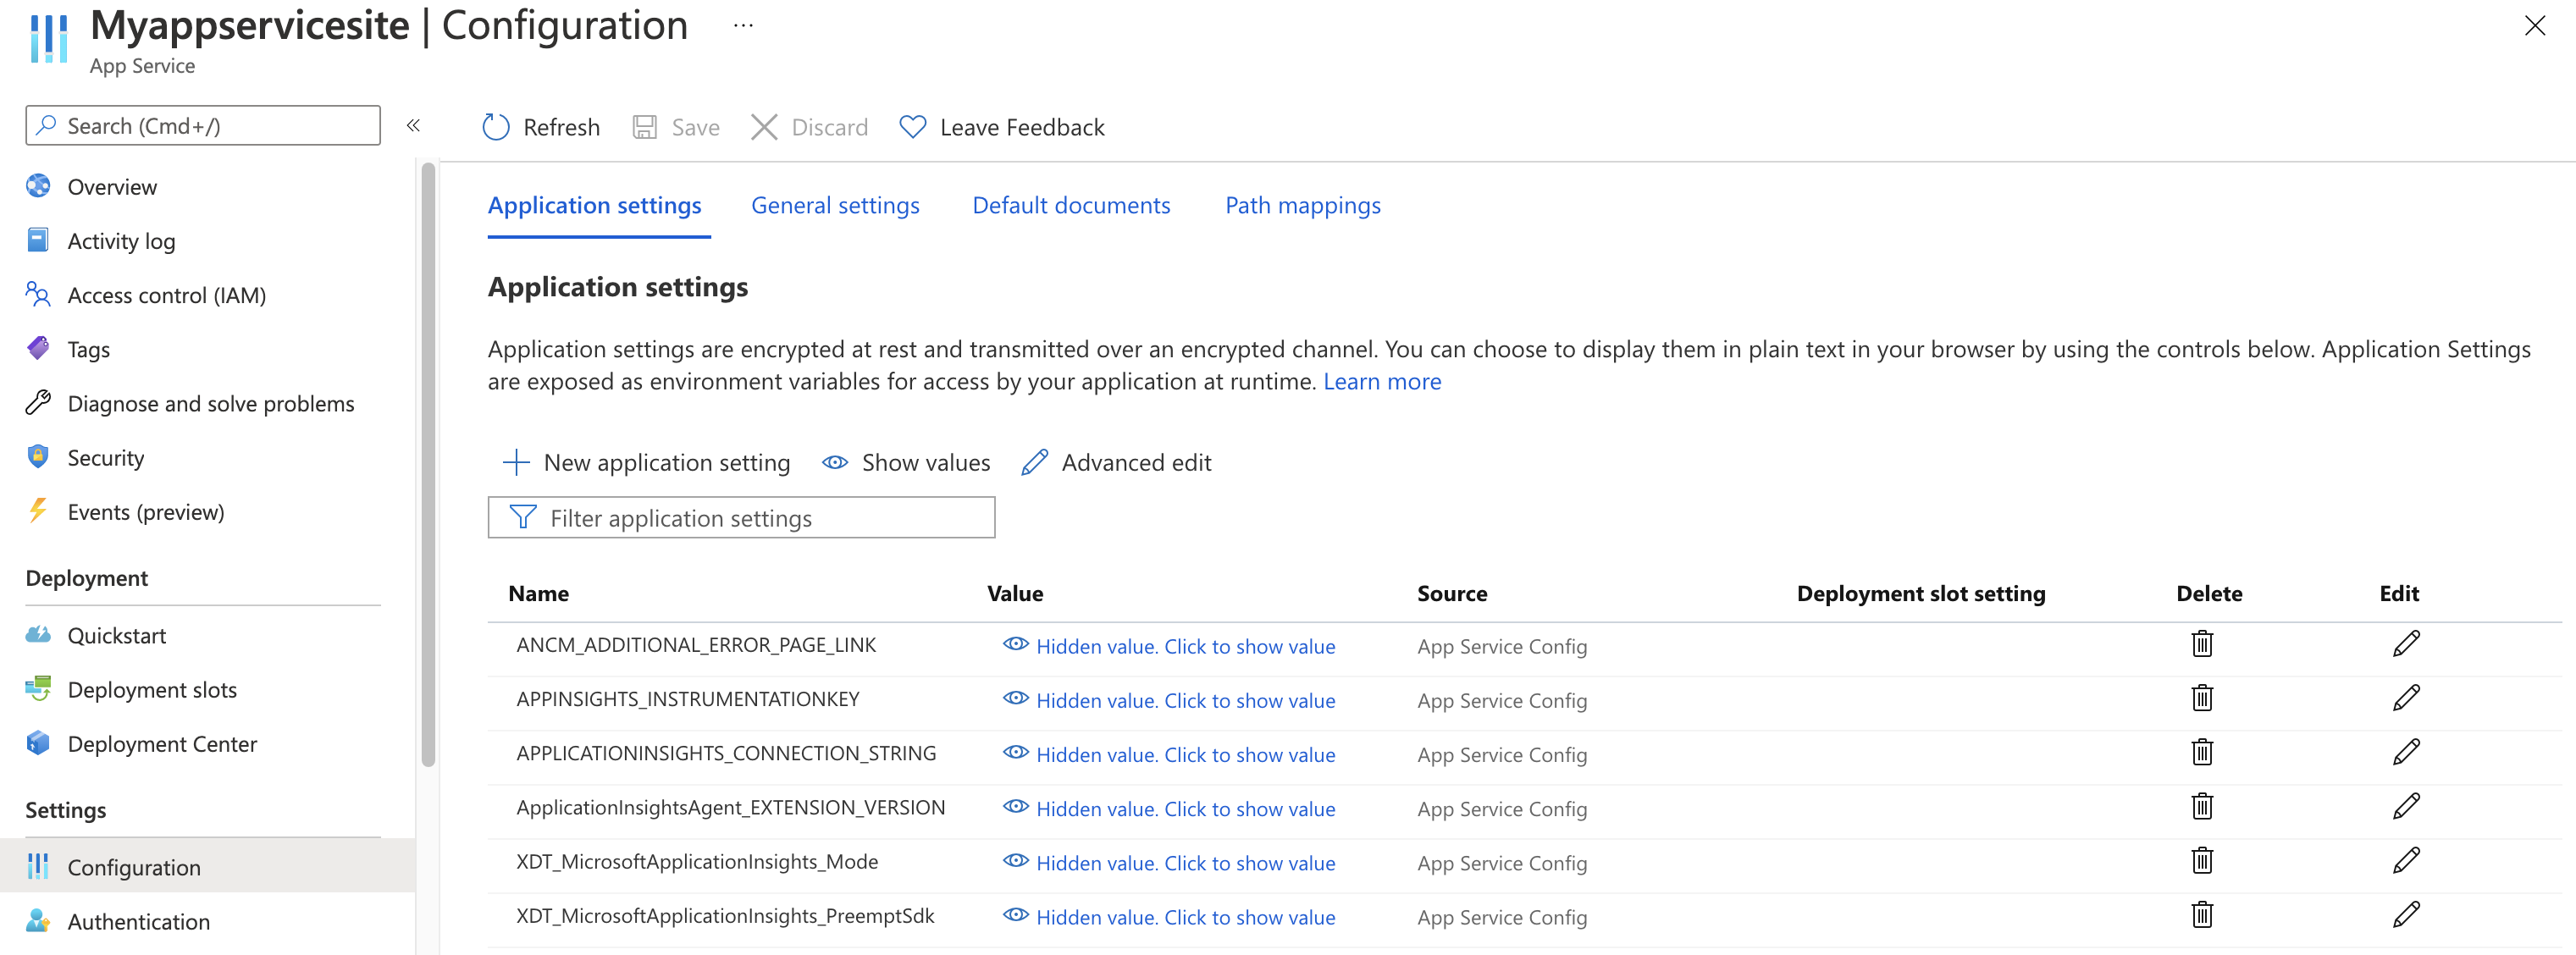
Scenario 2: Enabling During App Service Creation
A better practice for new applications is to provision monitoring from the start. The App Service creation wizard includes a "Monitoring" tab specifically for this purpose.
Azure Application Insights Tutorial | Amazing telemetry service
Let's return to the video by Adam Marczak. This time, he'll demonstrate how to enable Application Insights while creating a new App Service.
Watch the section from creating the app. Notice the "Monitoring" tab in the creation process and how he confirms the resulting application settings afterward.
Both of these codeless methods achieve the same outcome: your App Service is configured to send telemetry to Application Insights without any changes to your deployed code.
3. Verifying the Telemetry Flow
After enabling Application Insights, how do you know it's working? The quickest way is to use the Live Metrics stream, which gives you a real-time view of your application's health.
To see this in practice, let's watch the final segment of the video where the sample application is deployed and traffic is generated.
Azure Application Insights Tutorial | Amazing telemetry service
This final clip shows the result of all the configuration. After deploying the .NET application, you'll see telemetry appear in real-time.
Watch from deployment and verification. Focus on how the Live Metrics view reacts instantly to user requests and how the Application Map starts to build a visual topology of the system components.
Seeing requests and server metrics appear in the Live Metrics stream is the definitive confirmation that you have successfully configured Application Insights.
4. Code-based vs. Codeless: A Quick Comparison
While codeless autoinstrumentation is powerful, it's important to know that there's also a code-based approach. This involves:
- Adding the
Microsoft.ApplicationInsights.AspNetCoreNuGet package to your .NET project. - Adding
builder.Services.AddApplicationInsightsTelemetry();to yourProgram.csfile (in modern .NET).
So, when would you use one over the other?
Enable application monitoring in Azure App Service for .NET, Node ...
This official documentation explains the codeless approach and provides a crucial tip about when code-based instrumentation is necessary.
Read the section "Application Insights" and the subsection under the ASP.NET Core tab titled "Configure monitoring". The tip in the first section and the details in the second clarify the trade-offs.
As the documentation states:
- Codeless Autoinstrumentation is the recommended starting point. It's easy and provides a wealth of telemetry out of the box (requests, dependencies, exceptions, performance counters).
- Code-based Instrumentation is necessary when you need more control or want to send custom telemetry. For example, tracking how many times a specific business action occurs (e.g., "ShoppingCartCheckout") or recording custom trace messages.
Given your background as a software engineer, you can see the clear distinction: autoinstrumentation is about infrastructure-level configuration, while code-based instrumentation is about enriching that data from within the application logic itself.
Conclusion
In this lesson, you've learned how to establish a foundational layer of observability for your .NET applications on Azure App Service. This is a critical skill for operating reliable and performant cloud applications.
Key Takeaways:
- Application Insights is Azure's APM service for monitoring performance, diagnosing issues, and understanding usage in live applications.
- Autoinstrumentation is the "codeless" approach to enable Application Insights for an App Service. It works by adding application settings that link your app to an Application Insights resource.
- You can enable it either during App Service creation (on the Monitoring tab) or for an existing App Service (on the Application Insights blade).
- Live Metrics provides a real-time view of telemetry and is the best way to verify that your configuration is working correctly.
While the automatic telemetry is incredibly valuable, the real power comes when you augment it with application-specific data. In our next lesson, we will do just that. We'll dive into the code and instrument a .NET application with custom events, metrics, and telemetry using the Application Insights SDK.