Introduction
Hello! In our last lesson, we explored the theoretical structure of HTTP, the protocol that powers the web. We broke down requests and responses into their core components: methods, status codes, headers, and bodies. You learned what a GET request looks like and what a 200 OK or 404 Not Found response means.
Today, we're moving from theory to practice. This lesson is all about mastering the browser's Network tab in the developer tools. This is the de-facto tool for observing the live HTTP conversations between your browser and servers, and it's an essential skill for anyone working with web technologies. You'll learn how to capture, inspect, and analyze the traffic generated by loading a webpage, directly connecting the "book knowledge" from our last lesson to the real-world behavior of the internet.
Getting Started: The Network Panel
First things first, let's get acquainted with the tool. The Network panel logs all network activity a page initiates while the developer tools are open. It's your window into the raw data exchange.
To get a solid visual introduction, let's watch a short video from the Chrome Developers team.
Inspect Network Activity - Chrome DevTools 101
This video, 'Inspect Network Activity - Chrome DevTools 101', provides an excellent quickstart. It will show you how to open the panel and understand the main interface.
Watch from the beginning to 02:35. Focus on these key points: How to open DevTools and navigate to the Network panel. The importance of reloading the page after the panel is open. The meaning of the primary columns: Status, Type, Initiator, Size, Time, and the Waterfall.
The video gives a great overview. For a more detailed textual reference that you can follow along with, the official Chrome documentation provides a step-by-step guide.
Inspect network activity | Chrome DevTools
The official guide, 'Inspect network activity', walks you through opening the panel and logging your first requests using a live demo page. It's a great resource to have open as we proceed.
Read the sections 'Open the Network panel' and 'Log network activity'. I recommend opening the demo link provided in the article in another tab to follow along.
By now, you should be comfortable with the main view of the Network panel, where each row represents a single resource requested by the page.
Anatomy of a Request: The Details View
The real power of the Network tab comes from its ability to show you every detail of an individual HTTP exchange. By clicking on any request in the log, you can inspect its headers, body, timing, and more.
Let's look at the most important part: the Headers tab. This is where you'll see the HTTP methods, status codes, and headers we discussed in the last lesson.
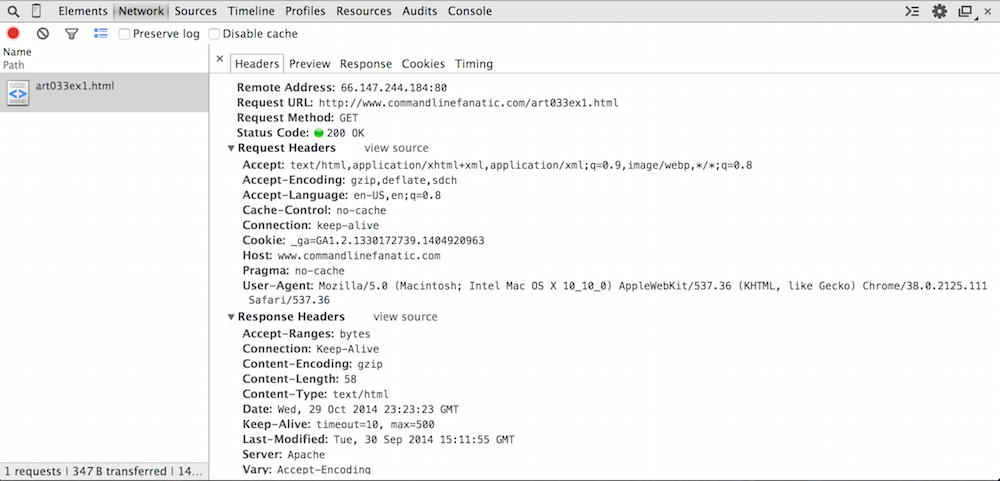
Now, let's see how to access and interpret this information in a live example.
Inspect Network Activity - Chrome DevTools 101
Continuing with the 'Chrome DevTools 101' video, this next segment shows how to dive into a specific resource.
Watch from 04:42 to 05:32. The video will walk you through the Headers, Preview, Response, and Timing tabs. Pay close attention to the Headers tab, as it's the most direct application of our previous lesson.
The Preview and Response tabs let you see the payload or body of the response. For an HTML file, the Response tab shows you the raw source code, while Preview shows a basic rendering of it. For other resources like images, Preview will show you the image itself.
Hands-On Practice: Let's Investigate
It's time to put your new skills to the test. We'll use the same demo page from the Chrome documentation for a guided investigation.
Please open this page with your DevTools Network tab open: Get Started Demo
Task 1: Analyze the Main Document
The very first request you see should be for getstarted.html. This is the base HTML document. Click on it to open the details view.
Now, find the answers to these questions:
- General section: What was the Request Method and the Status Code?
- Response Headers section: What is the value of the
content-typeheader? What does this tell the browser about the data it just received? - Request Headers section: Find the
user-agentheader. What does its value say about your browser and operating system? - Response tab: Look at the content in the
Responsetab. This is the HTML source code your browser received before parsing and rendering it.
Task 2: Analyze an AJAX Request
Modern web pages often fetch data in the background after the initial page load. This is done using a technique called AJAX, which relies on JavaScript to make HTTP requests.
On the demo page, click the "Get Data" button. You'll see a new request appear in your Network log for a file named getstarted.json. Click on this new request.
- What is the
Typeof this request, according to the main network log? (Hint: it's notdocument). - In the details view, look at the
content-typein the response headers. How is it different from the HTML document's content type? - Examine the
PreviewandResponsetabs. You're looking at a JSON object, a common format for exchanging data between a client and a server.
Task 3: Filtering and Searching
Real-world websites can load hundreds of resources, making the network log overwhelming. The Network panel has powerful filtering and searching tools to help you find what you need.
Inspect network activity | Chrome DevTools
Let's refer back to the Chrome documentation to learn how to filter the log and search across all requests.
Read the sections 'Search network headers and responses' and 'Filter resources'. Try out the examples on the demo page: Filter by type: Click the CSS and JS buttons to isolate stylesheets and scripts. Filter by string: Type png into the filter box to see only the PNG images. Search: Open the Search pane (Ctrl+F or Cmd+F) and search for Cache-Control. The tool will show you every occurrence of this header across all requests.
Seeing it in the Wild: A Complex Example
Demo pages are clean and simple. Let's take a quick look at a more realistic scenario. A single page load on a major website can involve dozens of connections to different servers for content, analytics, and ads. It can also involve different versions of the HTTP protocol.
Demystifying the Browser Networking Tab in Developer Tools With Examples
In this video, 'Demystifying the Browser Networking Tab', Hussein Nasser analyzes the network traffic of nginx.org. This will give you a feel for what a more complex network log looks like.
Watch the following two clips: 04:31 - 07:17: Notice how loading one HTML file (nginx.org) initiates requests for many other resources like images and CSS. Pay attention to the Connection ID column, which shows that many of these initial requests are happening over the same TCP connection. 09:06 - 11:30: This part shows a flurry of activity, including redirects (status code 307) and requests using different protocols like HTTP/1.1, HTTP/2 (h2), and even HTTP/3 (h3). You don't need to understand the details of each protocol yet, but it's valuable to see that the Network tab reveals all of this complexity.
This gives you a glimpse into the depth of information available. As you progress, you'll be able to diagnose complex loading performance issues, debug API calls, and understand the intricate dance of protocols that brings a modern webpage to your screen.
Conclusion
Congratulations! You've moved from understanding HTTP in theory to observing it in practice. The Network tab is no longer just a wall of text; it's a powerful diagnostic tool that you can now navigate with confidence.
Key Takeaways:
- The Network tab must be open before loading a page to capture all traffic.
- Each row in the log represents a request for a single resource (HTML, CSS, JS, image, etc.).
- Clicking a resource reveals detailed Headers, Response Body, and Timing information, allowing you to see the exact HTTP messages exchanged.
- You can use filtering and searching to quickly find specific requests or data within a busy network log.
- The Initiator column and the Waterfall view help you understand what triggered a request and how requests depend on each other.
Preview of the Next Lesson:
So far, we've focused on how the internet's protocols work as designed. But what happens when they are used maliciously? In our next module, we will dive into Network Security. Our first lesson will explore how attackers can exploit the local network with techniques like ARP spoofing to carry out Man-in-the-Middle attacks, a foundational concept in understanding network vulnerabilities.