Hello! Welcome back to your AWS Data Engineering certification course.
In our last lesson, we focused on building resilient Kinesis Data Firehose pipelines by configuring S3 backups for failed records. This handled errors after data was ingested. Today, we'll take a step back and address a fundamental performance challenge within the data stream itself: bottlenecks during ingestion.
This lesson directly addresses the learning outcome: Diagnose and resolve common streaming data issues, such as Kinesis hot shards. Mastering this is essential for building scalable and reliable real-time pipelines, a core competency tested on the Data Engineer - Associate exam. We'll explore what causes these issues, how to detect them using CloudWatch, and the strategies to fix them.
1. Understanding the Root Cause: Shards and Partition Keys
Before we can diagnose a problem, we need to understand the mechanics of Kinesis Data Streams. As a quick refresher, a data stream is composed of one or more shards. Each shard is a unit of capacity with fixed limits:
- Write Capacity: 1 MB per second OR 1,000 records per second.
- Read Capacity: 2 MB per second.
When your producer application sends a record to Kinesis, it must provide a PartitionKey. Kinesis uses this key to determine which shard the record will go to. It feeds the PartitionKey into an MD5 hash function, and the output of that hash maps to a specific shard.
This is where the problem of a "hot shard" originates. A hot shard occurs when a disproportionately large volume of data is sent to a single shard, exceeding its capacity and causing WriteProvisionedThroughputExceeded errors (throttling). This often happens while other shards in the same stream are sitting mostly idle.
To understand this better, let's explore why this happens and the importance of a good partition key strategy.
Optimize write throughput for Amazon Kinesis Data Streams
The following article, 'Optimize write throughput for Amazon Kinesis Data Streams,' explains the fundamental relationship between partition keys and shards. It provides a clear example of how a popular URL can create a hot shard.
Please read the section 'Why do we get write throughput exceeded errors?'. Focus on how the PartitionKey is hashed to select a shard and the example of the 'viral URL' that leads to a hot shard.
As the article explains, the choice of partition key is a critical design decision with a significant trade-off:
- High Cardinality Keys (e.g., UUID, request ID): These keys are highly random and distribute data evenly across all shards. This is excellent for maximizing throughput but makes it difficult for a consumer to process related records together, as they will be spread across different shards.
- Low Cardinality/Business Keys (e.g.,
customer_id,device_id): These keys ensure that all records for a specific entity go to the same shard. This is ideal for consumers that need to process events in order for a given entity (e.g., calculating a session). However, if one customer or device suddenly becomes extremely active, it can create a hot shard.
The challenge is to select a key that balances your consumer's processing needs with the need for even data distribution.
2. Diagnosing Hot Shards with CloudWatch
Now that we understand the cause, how do we detect a hot shard? The process is a multi-step investigation using Amazon CloudWatch metrics.
Step 1: Check Stream-Level Metrics
Your first stop should be the high-level metrics for the entire Kinesis stream. The key metric to alarm on is WriteProvisionedThroughputExceeded. If this metric is greater than zero, your producers are being throttled.
Next, look at IncomingBytes and IncomingRecords for the stream.
- If
IncomingBytesis approaching(Number of Shards) * 1 MB/s, you are hitting the byte limit. - If
IncomingRecordsis approaching(Number of Shards) * 1000 records/s, you are hitting the record count limit.
If the entire stream is at its limit, the solution is simple: you need to add more shards. However, the more common and subtle issue is seeing WriteProvisionedThroughputExceeded errors while the overall stream utilization is low. This is the classic symptom of a hot shard.

Step 2: Drill Down with Shard-Level Metrics
To confirm a hot shard, you need to look at the metrics for each individual shard. To do this, you must enable Enhanced (shard-level) metrics for your stream. This is a crucial step for troubleshooting.
Once enabled, you can plot IncomingBytes and IncomingRecords and group them by ShardId. This will quickly reveal if one shard is receiving significantly more traffic than others.
The following resource provides excellent detail on using both basic and enhanced metrics for diagnosis.
Optimize write throughput for Amazon Kinesis Data Streams
This section of the 'Optimize write throughput' article walks through the exact process of using CloudWatch metrics to diagnose throttling, including how to use enhanced metrics and CloudWatch Metrics Insights to pinpoint the problematic shard.
Read the section 'Identifying the cause of write throughput exceeded errors'. Pay close attention to the graphs that correlate WriteProvisionedThroughputExceeded with IncomingBytes and IncomingRecords. Also, note the SQL-like query for CloudWatch Metrics Insights, which is very useful for streams with many shards.
For streams with hundreds or thousands of shards, graphing them all is impractical. As the article points out, this is where CloudWatch Metrics Insights becomes invaluable. You can run a query to find the top N most utilized shards, for example:
-- Show top 5 shards with highest incoming records
SELECT SUM(IncomingRecords)
FROM "AWS/Kinesis"
WHERE StreamName = 'my-data-stream'
GROUP BY ShardId
ORDER BY SUM() DESC
LIMIT 5
This query immediately identifies your hottest shards without needing to visually inspect a crowded graph.
Test your understanding!
You are monitoring a Kinesis Data Stream with 10 shards. You notice a spike in the WriteProvisionedThroughputExceeded metric for the stream. However, when you check the stream-level IncomingRecords metric, it's steady at 4,000 records/second, well below the stream's total capacity of 10,000 records/second.
What is the most likely cause of the throttling, and what is your immediate next step to confirm your hypothesis?
Show answer
The most likely cause is a hot shard. The throttling errors combined with low overall stream utilization strongly suggest that data is not being distributed evenly.
The immediate next step is to enable and check the enhanced (shard-level) metrics. By viewing IncomingRecords grouped by ShardId, you can confirm if one or a few shards are receiving close to 1,000 records/second while others are underutilized.
3. Resolving Throughput Issues
Once you've diagnosed the problem, you can apply a solution. The right choice depends on the urgency and the root cause.
A. Immediate Mitigation: Scaling
If your application is failing and you need to restore service immediately, your best options involve scaling the stream's capacity.
-
Switch to On-Demand Mode: For provisioned streams, you can switch to on-demand capacity mode. In this mode, Kinesis automatically manages sharding to meet workload demands. This is the fastest way to resolve throttling but comes at a higher cost and abstracts away your control over shard count. It's an excellent "emergency button" while you investigate the root cause.
-
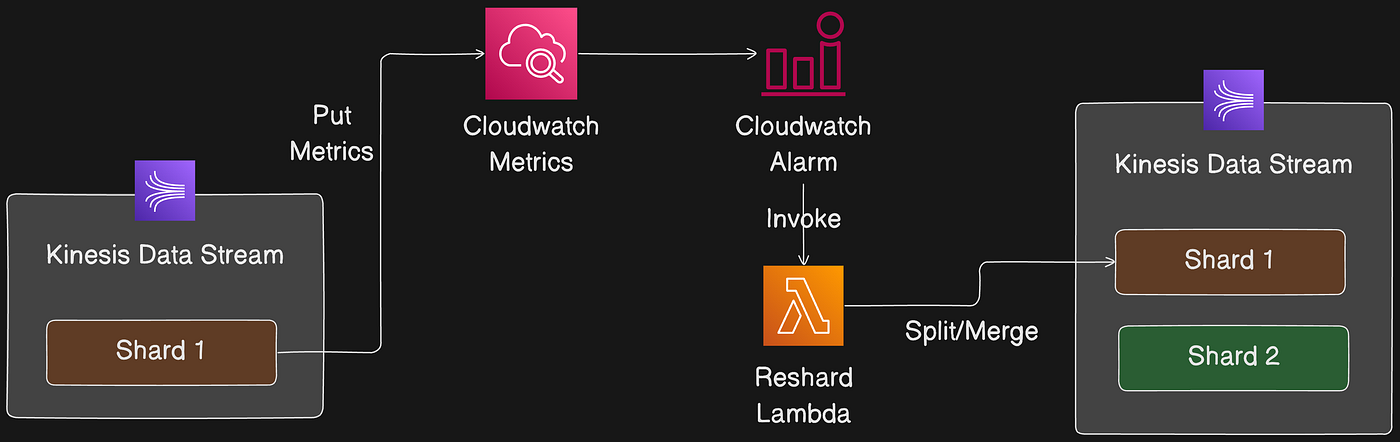
Reshard the Stream (Splitting): If you've identified a specific hot shard, you can perform a
SplitShardoperation on it. This divides the hot shard's hash key range into two new shards, effectively doubling the capacity for that range of data. You can continue to write to the stream while the split is in progress.
B. Long-Term Solution: Fixing the Partition Key Strategy
While scaling can treat the symptom, the best long-term solution is often to fix the cause: the poor partition key strategy.
-
Use a High-Cardinality Key: If your consumers do not require related records to be processed together, change your producer logic to use a highly random partition key, such as a UUID. This ensures the most even distribution of data.
-
Use a Composite Key: If you need to maintain data locality (e.g., for a specific
user_id) but one user is "hot," create a more granular composite key. For example, instead of justuser_id, useuser_id:session_id. This distributes that hot user's data across multiple shards (one per session) while still keeping data for other users grouped correctly. -
Use
ExplicitHashKey: For very advanced cases, you can bypass Kinesis's hashing. Your producer can calculate which shard to send data to and specify it directly using theExplicitHashKeyparameter. This gives you maximum control but also adds significant complexity to your application.
The following article provides a great overview of the scaling mechanisms and partition key considerations.
Under the hood: Scaling your Kinesis data streams
The article 'Under the hood: Scaling your Kinesis data streams' provides a great summary of the core concepts of scaling and the different API actions you can take.
Read the sections 'Core concepts that enable scaling' and 'Kinesis Data Streams scaling mechanisms'. Focus on the discussion of random vs. affinity-based partition keys and the descriptions of the SplitShard, MergeShards, and UpdateShardCount actions.
Conclusion
In this lesson, we tackled one of the most common and critical operational issues in Kinesis Data Streams. You learned how to diagnose and resolve throughput bottlenecks, particularly the "hot shard" problem.
Key Takeaways:
- Cause: Hot shards are caused by an uneven distribution of data, typically from a poorly chosen
PartitionKeythat sends too many records to one shard. - Diagnosis: Start with the stream-level
WriteProvisionedThroughputExceededmetric. Confirm a hot shard by enabling enhanced (shard-level) metrics and checkingIncomingBytes/IncomingRecordsper shard. Use CloudWatch Metrics Insights for large streams. - Resolution (Immediate): To restore service quickly, either switch to on-demand mode or perform a
SplitShardoperation on the hot shard. - Resolution (Long-Term): The best fix is often to improve your partition key strategy, either by adding randomness (UUID) or by creating more granular composite keys to better distribute the load.
In our next lesson, we will shift our focus from getting data into the stream to getting it out. We will cover how to process Kinesis streams using AWS Lambda, including Dead-Letter Queue (DLQ) configuration to handle processing failures on the consumer side.