Hello! In our last session, we built a strong foundation in mathematical reasoning, mastering percentages, ratios, and averages. Now, it's time to put those skills into action. This lesson focuses on Data Interpretation (DI), a crucial and high-scoring section of the UGC NET Paper 1. You are guaranteed to see a set of five questions based on a chart or table, making this a 10-mark section you can conquer with a systematic approach.
Our goal today is to interpret data presented in various visual formats—tables, bar charts, pie charts, and line graphs—to accurately and efficiently answer the associated questions. We will move beyond individual calculations and learn a strategic process for tackling complete DI sets, transforming visual information into exam marks.
1. The Data Interpretation Exam Pattern
First, let's understand what you'll be facing. The UGC NET has evolved its DI section over the years.
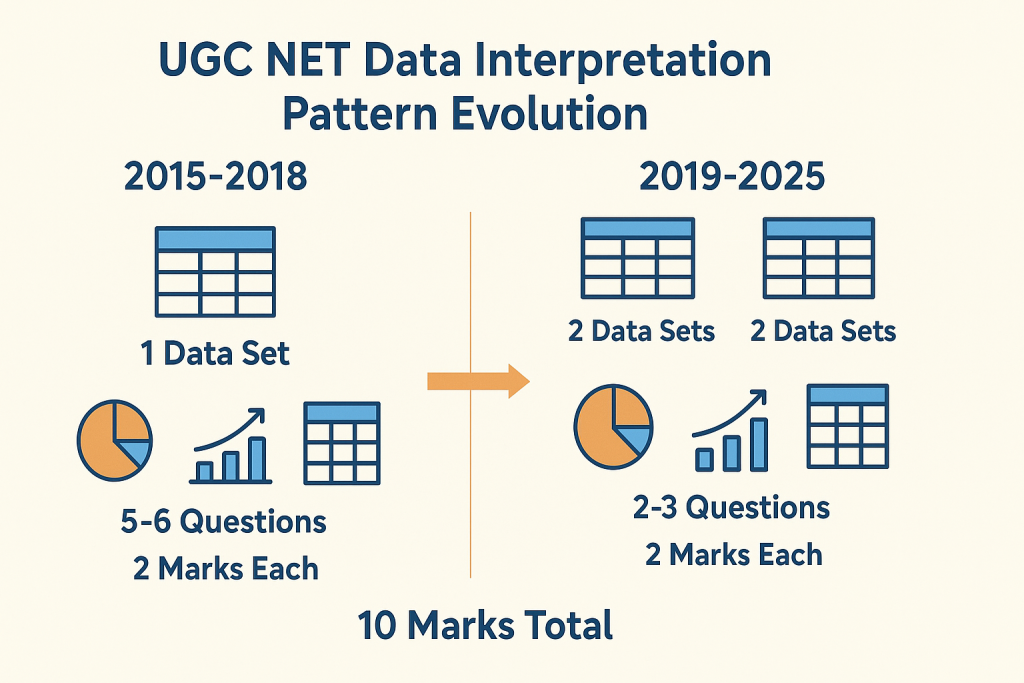
As you can see, you will likely encounter one or more data sets, each with 2-5 questions. The key isn't advanced mathematics; it's about speed, accuracy, and careful reading. Given your background in UI/UX design, you're already skilled at interpreting visual information and identifying patterns, which is a significant advantage here.
2. A Strategic Approach to All DI Questions
Regardless of the chart type, a consistent, methodical approach is the key to success. Think of it as a simple algorithm:
- Scan (30 seconds): Before reading any questions, take a moment to understand the data presentation. What is the title? What do the axes or columns/rows represent? What are the units (e.g., lakhs, thousands, percentages)?
- Read the Question Carefully: Identify exactly what is being asked. Underline key phrases like "percentage increase," "ratio of," "average of," or "what percentage of."
- Extract the Correct Data: Go back to the chart or table and pull only the specific numbers you need. A common mistake is using the wrong data point.
- Calculate: Apply the percentage, ratio, and average skills from our previous lesson. Use the shortcuts we discussed to save time.
- Verify: Does your answer make sense? A quick mental estimation can help you catch glaring errors. For example, if you're calculating a part of a whole, the result can't be larger than the whole.
3. Mastering the Different Chart Types
While the core skills of mathematical reasoning are universal, each chart type has its own nuances. A great resource, the Lawsikho blog on "Data Interpretation UGC NET," breaks down these types effectively.
Data Interpretation UGC NET - Lawsikho Blog
This article provides an excellent overview of the different chart types you'll encounter in the UGC NET exam and their relative frequency.
Please read the sections High-Weightage Topics and Low-Weightage Topics. Pay attention to the distinction between high-frequency charts (Tables, Pie Charts) and lower-frequency ones (Bar, Line). This will help you prioritize your practice.
Let's supplement this with a quick visual introduction to these chart types.
How to Read and Understand Common Data Charts
This video from Maven Analytics provides a clear, concise visual overview of how to interpret the most common charts.
Watch the following segments to get a feel for how to read each chart: Bar/Column Charts: Comparison between categories Line Charts: Trends over time Pie Charts: Parts of a whole
Now, let's dive into the strategy for each type, using solved examples.
A. Table-Based Questions (High Frequency)
Tables are the most common DI format. They present data in a structured grid of rows and columns. The key is to read them with precision.
Data Interpretation UGC NET - Lawsikho Blog
This section from the Lawsikho blog provides a step-by-step guide to tackling table-based questions, including a fully solved example.
First, read the strategies under Reading Tables Efficiently. Then, carefully study the Example 1: Company Expenditure Table and the step-by-step solution for Question 1. Once you understand the solution for Question 1, try to solve Question 2 and Question 3 on your own before revealing the solutions provided in the text.
B. Pie Chart Questions (High Frequency)
Pie charts represent parts of a whole, usually as percentages or degrees. The most important skill here is converting between these representations.
Data Interpretation UGC NET - Lawsikho Blog
This section explains the core concepts needed for pie charts, especially the crucial conversions between degrees and percentages.
Begin by reading Understanding Pie Chart Basics and Pie Chart Calculation Techniques. The conversion formulas are essential. Next, examine the Example: Employee Distribution Pie Chart. The text provides the solution for all three questions. Cover them up, and try to solve them yourself first using the data provided. This will test your ability to apply the concepts of finding actual values and comparing sectors.
Key Conversion Formulas:
- To convert degrees to percentage:
- To convert percentage to degrees:
C. Bar and Line Graph Questions (Lower Frequency)
Bar graphs are used for comparing quantities across categories, while line graphs are ideal for showing trends over time.
Data Interpretation UGC NET - Lawsikho Blog
This resource explains the strategies for interpreting these visually intuitive but sometimes tricky graph types.
Read the sections on Bar Chart Questions and Line Graph Question Strategies. Then, work through the Example: Year-wise Sales Bar Chart and the Example: Monthly Temperature Line Graph to see these principles in action.
4. Avoiding Common Pitfalls
Knowing the strategies is only half the battle. You also need to be aware of the common traps that can cost you marks.
Data Interpretation UGC NET - Lawsikho Blog
This final section from the Lawsikho blog is extremely important. It highlights the procedural errors that even well-prepared students make.
Read this section carefully, paying close attention to Misreading Units, Time Management, and Interpretation Errors. Actively thinking about these pitfalls will help you build a defensive checking mechanism during your practice and in the exam.
5. Integrated Practice
Let's consolidate our learning with a few practice questions from Testbook, which provides problems based on previous year's papers. Apply the 5-step strategy we discussed for each.
Data Interpretation Questions for UGC NET, Download 100+ Questions Based On PYP
This resource contains a collection of solved problems that mimic the style of the actual exam.
Please attempt the following questions. Try to solve each one before looking at the provided step-by-step solution. Question 1 (Bar Graph – Wheat and Pulses): A straightforward comparison question. Question 2 (Line Graph – Visitors): A classic percentage calculation ("what percent of"). Question 5 (Pie Chart – Employee Distribution): Involves finding the difference between two sectors. Question 7 (Bar Graph – Profit Analysis): A percentage increase problem.
Conclusion
Today, we've transitioned from learning the tools of mathematical reasoning to applying them in a full-fledged exam scenario. Data Interpretation is a test of process, precision, and pace.
Key Takeaways:
- Adopt a System: Always use the 5-step method: Scan, Read, Extract, Calculate, Verify.
- Know Your Charts: Understand the primary purpose of each chart type—tables for structured data, pie charts for composition, bar charts for comparison, and line graphs for trends.
- Master the Math: Your ability to quickly calculate percentages, averages, and ratios is the engine of DI. Don't forget the shortcuts from our last lesson.
- Beware of Traps: Double-check units, read questions carefully, and manage your time wisely. Every question is worth the same marks, so don't get stuck.
In our next lesson, we will shift gears to cover the theoretical knowledge areas of Paper 1. We'll start by recalling the key concepts of ICT (Information and Communication Technology), People & Environment, and the Higher Education system in India.