Welcome to the final lesson in our Digital Marketing Foundations module. In our previous session, we visualized the customer's experience by creating a journey map. We now understand the path a person takes from a stranger to a customer. Today, we'll learn how to measure progress along that path by matching key performance metrics to each stage of the marketing funnel.
This lesson is fundamental to your goal of mastering performance marketing. The core principle of performance marketing is a relentless focus on measurable outcomes. You can't optimize what you can't measure. By the end of this hour, you will have a clear framework for evaluating the success of any marketing activity, which will be essential as we move into hands-on topics like paid advertising and analytics.
What Is a Key Performance Indicator (KPI)?
Before we dive into the funnel, let's clarify our terms. You will often hear the words "metric" and "KPI" used interchangeably, but they have a subtle and important difference.
- A metric is any piece of data you can measure. Website visits, social media likes, and email opens are all metrics.
- A Key Performance Indicator (KPI) is a metric that is directly tied to a primary business objective. It's a key measure of performance that tells you if you are on track to meet your goals.
For example, the number of impressions on an ad is a metric. But the Click-Through Rate (CTR) of that ad is a KPI because it measures how effectively the ad is driving traffic, a specific business goal. The true power of a KPI is that it helps you make decisions.
Mapping Metrics to the Funnel
The marketing funnel provides a perfect structure for organizing our KPIs. The metrics that matter at the top, when you're trying to build awareness, are very different from those at the bottom, when you're focused on closing a sale.
Let's begin our journey through the funnel by looking at a comprehensive article from Well-Oiled Marketing. It provides a detailed breakdown of the goals and metrics for each stage. We will explore it section by section.
Start by reading the introduction and the first section on the Awareness stage. This will set the context and introduce the first set of crucial metrics.
Read from the beginning down to the end of the section on Awareness, stopping before "Section 2: Consideration". Pay close attention to the list of metrics and their explanations.
Top of the Funnel (TOFU): Awareness
As the article explained, the goal at the top of the funnel is to make a first impression and attract a broad audience. You want to introduce your brand to people who have a problem your business can solve, even if they don't know you exist yet.
As an SEO analyst, you are already very familiar with some key TOFU metrics. Your work on backlinks directly influences your site's authority, which in turn impacts organic search rankings and traffic.
Here are the primary KPIs for the Awareness stage:
- Impressions: The number of times your content (an ad, a search result, a social post) is displayed. It's a measure of potential reach.
- Reach: The number of unique people who see your content.
- Website Traffic / Sessions: The number of visits to your website. A core metric you'll find in Google Analytics.
- Branded Search Volume: The number of people searching for your brand name directly. A strong indicator of brand recognition.
- Ad Click-Through Rate (CTR): The percentage of people who click your ad after seeing it. This is a primary KPI for paid advertising channels like Google and Facebook Ads.
The video below from SiteGround.com provides excellent, clear definitions for Impressions and CTR.
Key Digital Marketing Metrics to Improve Your Results
Watch this segment for a practical explanation of two foundational TOFU metrics.
Watch the section on Impressions to understand brand exposure, and then the section on Click-Through Rate to see how it measures content relevance.

Middle of the Funnel (MOFU): Consideration
Once a potential customer is aware of your brand, they move into the middle of the funnel. Here, they are actively considering their options and researching solutions. Your goal is to engage them, build trust, and position your offering as the best choice. This is where you transform a casual visitor into a lead.
Let's continue with the Well-Oiled Marketing article to explore the KPIs for this stage.
Now, read the second section of the article, which focuses on the Consideration stage.
Find and read "Section 2: Consideration – Engaging and Informing" in its entirety, from the key goals through the practical insights.
At this stage, we are interested in two types of metrics: those that measure engagement and those that measure lead generation.
Engagement Metrics:
- Average Time on Page / Session Duration: A longer duration suggests visitors find your content valuable.
- Pages per Session: How many pages, on average, a visitor views. This indicates how deeply they are exploring your site.
- Bounce Rate: The percentage of visitors who leave after viewing only one page. A high bounce rate can indicate that your page content didn't match their expectations.
- Social Media Engagement: Likes, comments, and shares show that your content is resonating with your audience.
Lead Generation Metrics:
- Email Subscription Rate: The percentage of visitors who sign up for your mailing list.
- Lead Magnet Downloads: The number of times users download a resource like an ebook or a whitepaper in exchange for their contact information.
- Cost Per Lead (CPL): A critical performance marketing KPI. It measures how much you spend, on average, to acquire one new lead.
The SiteGround video offers further insights into key engagement metrics like sessions, time on page, and bounce rate.
Key Digital Marketing Metrics to Improve Your Results
This part of the video explains how to interpret user behavior on your website.
Watch the explanations for Sessions, Average time on page, and Bounce rate.
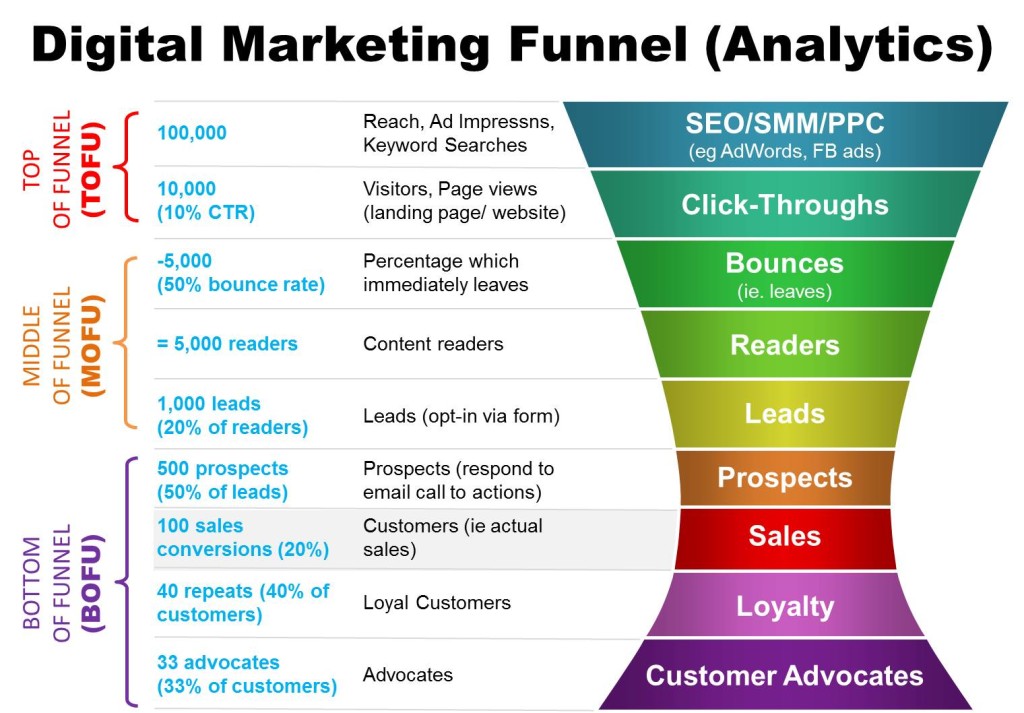
Bottom of the Funnel (BOFU): Conversion, Retention, and Advocacy
This is the final and most crucial part of the funnel, where business impact is directly measured. Your goal is to convert leads into customers (Conversion), ensure they have a great experience and come back (Retention), and turn them into brand promoters (Advocacy).
Let's finish our reading of the Well-Oiled Marketing article to cover the metrics for these final stages.
Read the final two sections covering the Conversion and Retention stages. These contain the most important metrics for performance marketing.
Read "Section 3: Conversion – Make The Sale" from start to finish. Then continue with "Section 4: Retention – Cultivating Loyalty" from its beginning to the end of the practical insights.
The metrics at this stage are often financial and are the ultimate indicators of marketing success.
Conversion Metrics:
- Conversion Rate: The percentage of visitors or leads who complete a target action (e.g., make a purchase, request a demo). This is arguably the most important performance KPI.
- Customer Acquisition Cost (CAC): The total sales and marketing cost required to acquire one new customer. A sustainable business must have a CAC that is significantly lower than its customer lifetime value.
- Average Order Value (AOV): The average amount a customer spends per transaction.
- Return on Ad Spend (ROAS): Measures the gross revenue generated for every dollar spent on advertising. A ROAS of 4:1 means you earn $4 for every $1 you spend.
- Return on Investment (ROI): A broader measure of profitability that considers all costs associated with a marketing campaign, not just ad spend.
Retention & Advocacy Metrics:
- Customer Lifetime Value (CLV or LTV): The total revenue a business can expect from a single customer throughout their entire relationship.
- Repeat Purchase Rate: The percentage of customers who have made more than one purchase.
- Net Promoter Score (NPS): A measure of customer loyalty and satisfaction, based on how likely they are to recommend your brand to others.
The SiteGround video provides detailed walkthroughs of these critical bottom-of-funnel and financial metrics. Understanding these is essential for your performance marketing goal.
Key Digital Marketing Metrics to Improve Your Results
This final viewing segment covers the most important metrics for measuring profitability and customer value.
Watch the sections explaining Conversion rate, Customer Acquisition Cost (CAC), and Return on Investment (ROI). For further context on customer value, also review the sections on Repeat purchase rate and Customer Lifetime Value (CLV).
A Consolidated View
To tie everything together, it's helpful to see these metrics laid out in a simple table. The resource below from Sprints & Sneakers does an excellent job of assigning a primary KPI and secondary metrics to each funnel stage.
Your Full-Funnel Marketing Strategy: An AI-Powered Guide | Sprints & Sneakers
This table provides a concise, at-a-glance summary of the most important KPIs for each funnel stage, distinguishing between B2B and B2C business models.
Focus on the table under the heading Set stage-specific goals. Notice how each stage has a single primary KPI, which is the one metric that matters most for making decisions at that stage.
For a final, quick reinforcement of these concepts, the following video clip from HubSpot provides a rapid-fire summary of which KPIs to monitor at each stage.
How to Build a Marketing Funnel that Actually Works for your Business
Watch this very short clip for a quick review of the key metrics mapped to the Awareness, Interest, Consideration, and Decision stages.
Watch from this segment, where the presenter lists the specific metrics to track for each part of the funnel.
Conclusion
In this lesson, we have built a comprehensive measurement framework by matching key performance indicators to each stage of the marketing funnel. This framework allows you to diagnose the health of your marketing efforts and make data-driven decisions.
Here are your key takeaways:
- KPIs are decision-making tools. They are specific metrics tied to business goals that tell you if your strategies are working.
- Metrics change with the funnel stage. Awareness is about reach (Impressions, Traffic), Consideration is about engagement and lead generation (Time on Page, CPL), and Conversion is about profitable action (Conversion Rate, CAC, ROAS).
- Performance marketing is data-driven. Your goal is to systematically analyze these KPIs to find bottlenecks and opportunities, then run tests to improve them.
This lesson concludes our first module, Digital Marketing Foundations. You now have a solid understanding of the digital marketing ecosystem, the customer journey, and how to measure success.
In our next module, we will dive back into your area of expertise, SEO, but with a new lens. We'll start with in-depth keyword research, where you will learn how to find the exact terms and phrases your audience uses at each stage of the funnel. This is the first practical step in connecting strategy to execution.