Welcome to your high-intensity crash course for the linear regression exam. With the exam tomorrow, we need to be efficient and ruthlessly practical. This first lesson is designed to get you comfortable and fast with the main R outputs you'll face. Your professor will likely present you with tables from R's summary() and anova() functions, and your first task is always to know exactly what you're looking at.
Today's goal is purely navigational: we will learn to locate the key statistics in these outputs—coefficients, p-values, R-squared, and the F-statistic. We'll leave the deep interpretation and calculations for the upcoming lessons. Mastering this orientation is the foundation for every question you will answer.
Let's begin.
The Command Center: The summary() Output
The most comprehensive output for a regression model in R comes from the summary() function. Think of it as your main dashboard. It contains information about the model's coefficients, how well the model fits the data, and its overall significance.
To get a complete tour of this output, I'd like you to read a section from the excellent "Learning statistics with R" guide. It breaks down a sample summary() output piece by piece, explaining where to find everything you need.
This section from "Learning statistics with R" provides a detailed, line-by-line breakdown of a typical summary() output for a multiple regression model. It's the most important section for our current goal.
Please read the entire section titled "15.5.3 Running the hypothesis tests in R". As you read, focus on creating a mental map of the output. Pay close attention to the annotated R output, specifically locating: The Coefficients table, which lists the intercept and predictor estimates. The line that reports the degrees of freedom. The final block of text, which contains the R-squared, Adjusted R-squared, and the overall F-statistic with its p-value.
Excellent. The reading provides a detailed walkthrough. For your exam, you need to be able to extract this information instantly. Here is a "cheat sheet" summarizing where to find the key statistics within the summary() output:
| Key Statistic | Location in summary() Output |
Brief Purpose (More in later lessons) |
|---|---|---|
| Coefficients () | Coefficients table, Estimate column |
These are the intercept and slope values for your regression equation. |
| Individual p-values | Coefficients table, `Pr(> |
t |
| R-squared | Bottom section, Multiple R-squared |
Measures the proportion of the response variable's variance explained by the model. |
| F-statistic | Bottom section, F-statistic line |
Tests the overall significance of the model (i.e., are any of the predictors useful?). |
| Overall p-value | Bottom section, p-value on the F-statistic line |
This is the p-value associated with the overall F-test. |
The following video from StatQuest provides a great visual reinforcement of this, walking through the summary() output with clear, step-by-step narration.
Linear Regression in R, Step by Step
Watch this StatQuest video for a dynamic walkthrough of the summary() output. It reinforces what you just read and helps solidify your mental map of where everything is.
The initial sections: This covers the call and a quick look at residuals. The coefficients section: Pay close attention here. Josh Starmer points out the estimates, standard errors, t-values, and p-values, just like in the reading. Model fit statistics: This part clearly shows you where to find R-squared, the F-statistic, and the overall model p-value at the bottom of the output.
The Variance Breakdown: The anova() Output
While summary() gives a comprehensive overview, the anova() function provides a different perspective. It gives you the "Analysis of Variance" table, which breaks down the total variability in your data into components attributable to your model and the unexplained error.
For a simple linear regression (one predictor), the F-test in the ANOVA table is the same as the overall F-test at the bottom of the summary() output. For multiple regression, it can be used to compare different models, a topic we'll explore later. For now, let's just focus on identifying the parts of a standard ANOVA table.
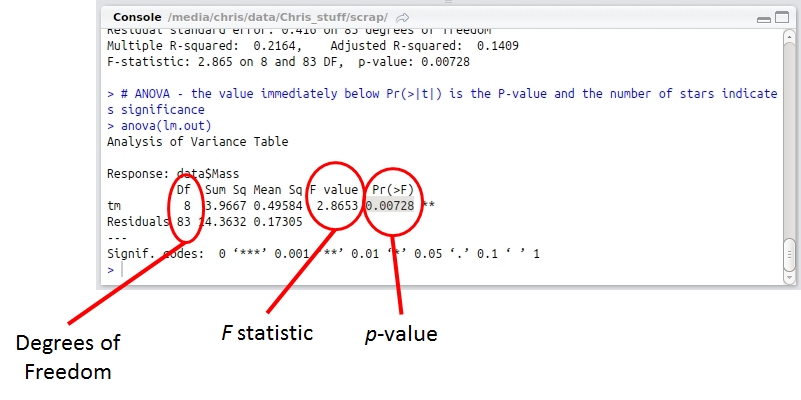
The video below quickly shows how to generate this table in R and confirms its relationship with the summary() output.
Simple Linear Regression in R | R Tutorial 5.1 | MarinStatsLectures
This short clip from MarinStatsLectures demonstrates how to generate the ANOVA table and explicitly connects it to the summary() output you've just learned about.
Watch this part where the presenter runs the anova() command and points out that the F-test presented in the ANOVA table corresponds to the F-test in the last row of the summary() output.
This is a critical connection. On an exam, if you are given both outputs for the same simple regression, you should expect the F-statistic and its p-value to match.
Practice Drill
Time for a quick check. This is exactly the kind of task you'll face on the exam. Look at the R output below and find the requested values.
Call:
lm(formula = salary ~ years_exp, data = JobData)

Residuals:
    Min      1Q  Median      3Q     Max
-8432.1 -2934.5   397.8  2487.6  9876.5

Coefficients:
            Estimate Std. Error t value Pr(>|t|)
(Intercept)  25792.2     2274.1   11.34   <2e-16 ***
years_exp     9449.9      378.8   24.95   <2e-16 ***
---
Signif. codes:  0 '***' 0.001 '**' 0.01 '*' 0.05 '.' 0.1 ' ' 1

Residual standard error: 5788 on 28 degrees of freedom
Multiple R-squared:  0.957,	Adjusted R-squared:  0.9555
F-statistic: 622.5 on 1 and 28 DF,  p-value: < 2.2e-16
Your Task:
- What is the value of the intercept coefficient ()?
- What is the value of the slope coefficient for
years_exp()? - What is the p-value for the
years_expcoefficient? - What is the Multiple R-squared value?
- What is the overall F-statistic for the model?
Solutions:
- The intercept estimate is 25792.2. (Found in the
Estimatecolumn,(Intercept)row). - The slope estimate for
years_expis 9449.9. (Found in theEstimatecolumn,years_exprow). - The p-value for
years_expis < 2.2e-16. (Found in thePr(>|t|)column,years_exprow). This very small number indicates the coefficient is statistically significant. - The Multiple R-squared is 0.957. (Found in the bottom section).
- The F-statistic is 622.5. (Found in the last line of the output).
If you were able to locate these five values quickly, you have successfully met today's objective.
Conclusion
In this first, foundational lesson, we focused on one critical skill: navigating R's regression outputs. You now have a mental map to instantly locate the key statistics in both summary() and anova() tables. We've established that the summary() output is your main dashboard, providing coefficients, individual p-values, and overall model fit statistics like R-squared and the F-statistic. The anova() table offers a focused look at the breakdown of variance.
In our next lesson, we will move from locating these numbers to interpreting them. We'll start with the intercept () and slope () for a simple linear regression model and practice crafting the kind of precise, two-line exam answers your professor is looking for.