Hello!
In our previous lesson, we examined the consequences of multicollinearity—a problem arising from strong relationships between your predictor variables. We saw how it inflates standard errors and makes coefficient estimates unstable, compromising our ability to interpret the individual impact of each predictor.
Today, we shift our focus from issues between variables to problems with individual data points. Not all data points are created equal. Some have the power to single-handedly distort your entire regression model. Your goal for this lesson is to master the crucial distinction between a high-leverage point (one with an unusual predictor value) and a high-influence point (one that actually changes the model's parameters). Understanding this difference is key to building a robust and reliable model.
Untangling Leverage, Outliers, and Influence
In regression diagnostics, three terms are often used—and confused—to describe problematic data points: outlier, leverage, and influence. Let's define them precisely.
- Outlier: An observation with a large residual. In simple terms, its
yvalue is far from the regression line. It represents a surprise in the vertical direction. - Leverage: An observation with an extreme predictor (
x) value. A high-leverage point sits far from the other data points in the horizontal direction. It has the potential to exert strong pull on the regression line, much like a person sitting on the very end of a see-saw has more "leverage" than someone in the middle. Leverage depends only on the x-values. - Influence: An observation that, if removed, would cause a significant change in the model's fit (i.e., the slope and intercept). An influential point is one that has actually used its leverage to pull the line towards it.
The most important takeaway is this: Influence is a combination of leverage and how much of an outlier a point is. A point can have high leverage but low influence if it happens to fall in line with the trend of the other data.
The following video provides an excellent visual demonstration of these concepts.
Leverage and Influential Points in Simple Linear Regression
This video from the jbstatistics channel is one of the clearest explanations available for distinguishing leverage and influence.
Please watch the first three minutes and fifty-five seconds of the video, which covers all the core concepts. Pay close attention to the visual examples of how different types of points affect the regression line. Low Leverage, Some Influence: Notice how the outlier is unusual in the y-direction but not the x-direction. It pulls the line, but not drastically. High Leverage, High Influence: Here, the outlier is also extreme in the x-direction. See how its removal causes a dramatic shift in the regression line. Comparing All Cases: This section masterfully contrasts four scenarios, including the crucial case of a high-leverage, low-influence point.
A Visual Summary of Problematic Points
The video you just watched demonstrated four key scenarios. The image below, taken from the video, provides a perfect static summary. Let's break down each case, as this is exactly what you need to know for your exam.
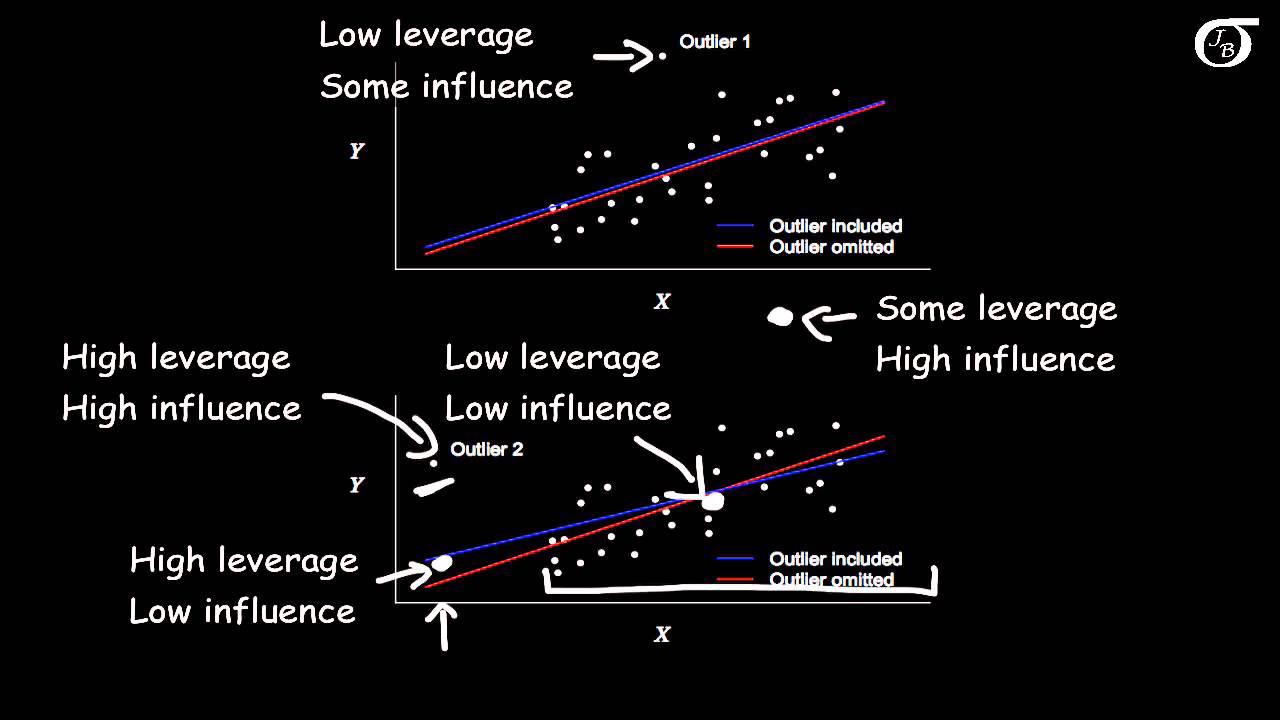
- Low leverage, Some influence (Outlier 1): This point is an outlier because it has a large residual (it's far from the line vertically). However, its x-value is not extreme, so it has low leverage. It pulls on the line, but its influence is limited.
- High leverage, Low influence (bottom left): This point has an extreme x-value, giving it high leverage. However, it falls almost perfectly on the trend line established by the other points. Removing it would barely change the model. It has potential for influence, but doesn't use it.
- High leverage, High influence (top left, "Outlier 2"): This is the most dangerous combination. The point has an extreme x-value (high leverage) AND is far from the overall trend (large residual). It acts like a powerful magnet, pulling the entire regression line towards itself and distorting the results.
- Low leverage, Low influence (center): This point is close to the other data points in both x and y directions. It's a "well-behaved" point with minimal leverage and influence.
For a concise, text-based reinforcement of this critical distinction, the following reading is excellent.
Outliers vs. Influential Points in Regression | MetricGate
This article from MetricGate provides a sharp, clear definition of the difference between leverage and influence.
Please read the section titled Leverage vs. Influence. Pay special attention to the "Key insight" box, which perfectly summarizes the relationship.
Quantifying Influence: Cook's Distance
While visually inspecting a scatter plot is useful, statisticians need a formal metric to quantify influence. The most common measure is Cook's Distance.
Cook's Distance is a single number that summarizes the influence of a data point. It measures how much all the fitted values in the model would change if that one observation were removed. It elegantly combines information about a point's leverage and its residual size.
- A large Cook's distance means a point is influential.
- A small Cook's distance means a point is not influential.
The following video provides a quick introduction to Cook's Distance and the standard diagnostic plot used to find influential points.
Simple Linear Regression: Diagnostics (part 4 of 4)
This video from the "Biostatistics" channel introduces Cook's Distance in the context of the Residuals vs. Leverage plot.
Watch the segment from the third example. The narrator introduces Cook's distance as a way to encapsulate the dangerous combination of high leverage and a large residual, and provides rules of thumb for interpretation.
As the video mentions, there are rules of thumb for interpreting Cook's Distance:
- D > 0.5: The point is considered anomalous and warrants investigation.
- D > 1.0: The point is considered highly influential and is very likely distorting your model.
Another common, and often more practical, rule of thumb is to flag points where D > 4/n, where n is your sample size.
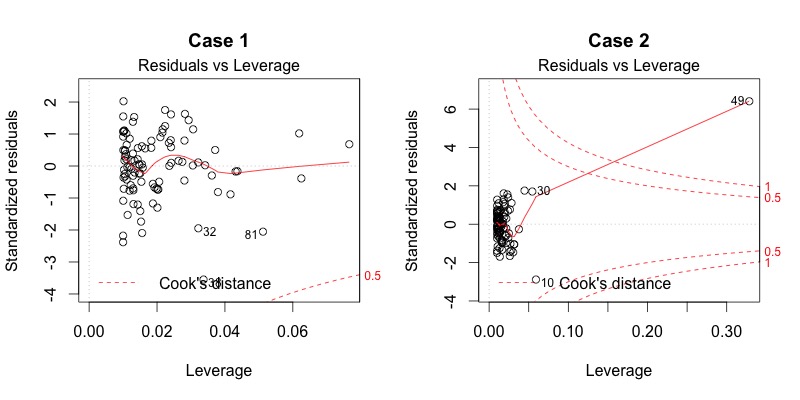
In the next lesson, we will dive deep into interpreting the Residuals vs. Leverage plot, which is designed specifically to help you spot these problematic points. It places leverage on the x-axis, the standardized residual on the y-axis, and uses contour lines to show Cook's Distance, neatly bringing all three concepts together in one graph.
Practice Drill
You are given the following descriptions of three data points in a simple linear regression model. Classify each point in terms of its likely leverage and influence.
- An observation has a predictor value (
x) very close to the averagexof all data points, but its response value (y) is extremely high, making its residual the largest in the dataset. - An observation has the highest predictor value (
x) in the dataset by a large margin. However, itsyvalue is almost exactly what the regression model (fit on all other points) would have predicted. - An observation has both the lowest predictor value (
x) in the dataset and ayvalue that is far below the trend established by the other points.
Solution
- Low Leverage, Moderate Influence. The
xvalue is not extreme, so leverage is low. Because the residual is large, it will still pull on the line, giving it some (but not high) influence. - High Leverage, Low Influence. The extreme
xvalue gives it high leverage. However, because its residual is near zero (it fits the model well), it has very little actual influence on the model's coefficients. - High Leverage, High Influence. The extreme
xvalue gives it high leverage, and the large residual (far from the trend) means it will exert a strong pull on the regression line, making it highly influential.
Conclusion
You have now learned to distinguish between three critical concepts: outliers, leverage, and influence. This is not just academic terminology; it is essential for diagnosing the health of your regression model.
Key Takeaways for Your Exam:
- Leverage is potential. It comes from an unusual x-value.
- Influence is impact. It's the actual change a point causes to the model's slope and intercept.
- Influence = Leverage + Residual Size. To be highly influential, a point generally needs both high leverage (an extreme x-value) and a large residual (it doesn't fit the overall pattern).
- Cook's Distance is the key metric used to quantify a point's influence.
In our next lesson, we will put this knowledge into practice by learning to visually identify these problematic points on standard R diagnostic plots, particularly the "Residuals vs. Leverage" plot.