Hello! In our previous lesson, we established the critical difference between leverage (potential impact due to an extreme X-value) and influence (the actual change a point causes to the model). We defined Cook's Distance as the key metric for quantifying influence.
Today, we will put that theory into practice. Your exam will almost certainly include a Residuals vs. Leverage plot, and you will be expected to interpret it instantly. This lesson focuses entirely on mastering that single, powerful diagnostic tool. By the end, you'll be able to look at one of these plots and immediately spot the data points that are distorting your regression model.
Anatomy of the Residuals vs. Leverage Plot
This plot is designed to show you a point's leverage and its residual size simultaneously, allowing you to spot influential points at a glance. It's one of the default diagnostic plots in R, typically produced by the command plot(model, 5).
Let's break down its components:
- X-Axis: Leverage (or Hat Value): This measures how extreme a point's predictor (
x) values are. Points further to the right have higher leverage and more potential to influence the model. - Y-Axis: Standardized Residuals: This is the residual (the error, ) scaled by its standard error. Points far from the horizontal line at zero (either high up or low down) are outliers in the y-direction.
- Dashed Red Lines: Cook's Distance Contours: These are the most important part for a quick diagnosis. They represent lines of equal influence. Any point that falls outside of these dashed lines is considered an influential point.
The following article provides a concise and practical guide to interpreting this plot.
What is a Residuals vs. Leverage Plot? (Definition & Example)
This Statology article gets straight to the point of how to read and interpret the Residuals vs. Leverage plot.
Focus on the first two sections, the introduction and how to interpret the plot. Pay close attention to the clear rule: if a point falls outside the dashed Cook's distance line, it's influential.
Reading the Plot: A Practical Guide
As the reading makes clear, the goal is to find points that have both high leverage (far right) and a large residual (far from y=0). These are the points that land in the top-right or bottom-right corners of the plot and are most likely to cross the Cook's Distance contours.
The image below provides a perfect illustration of the three key scenarios you must be able to distinguish.
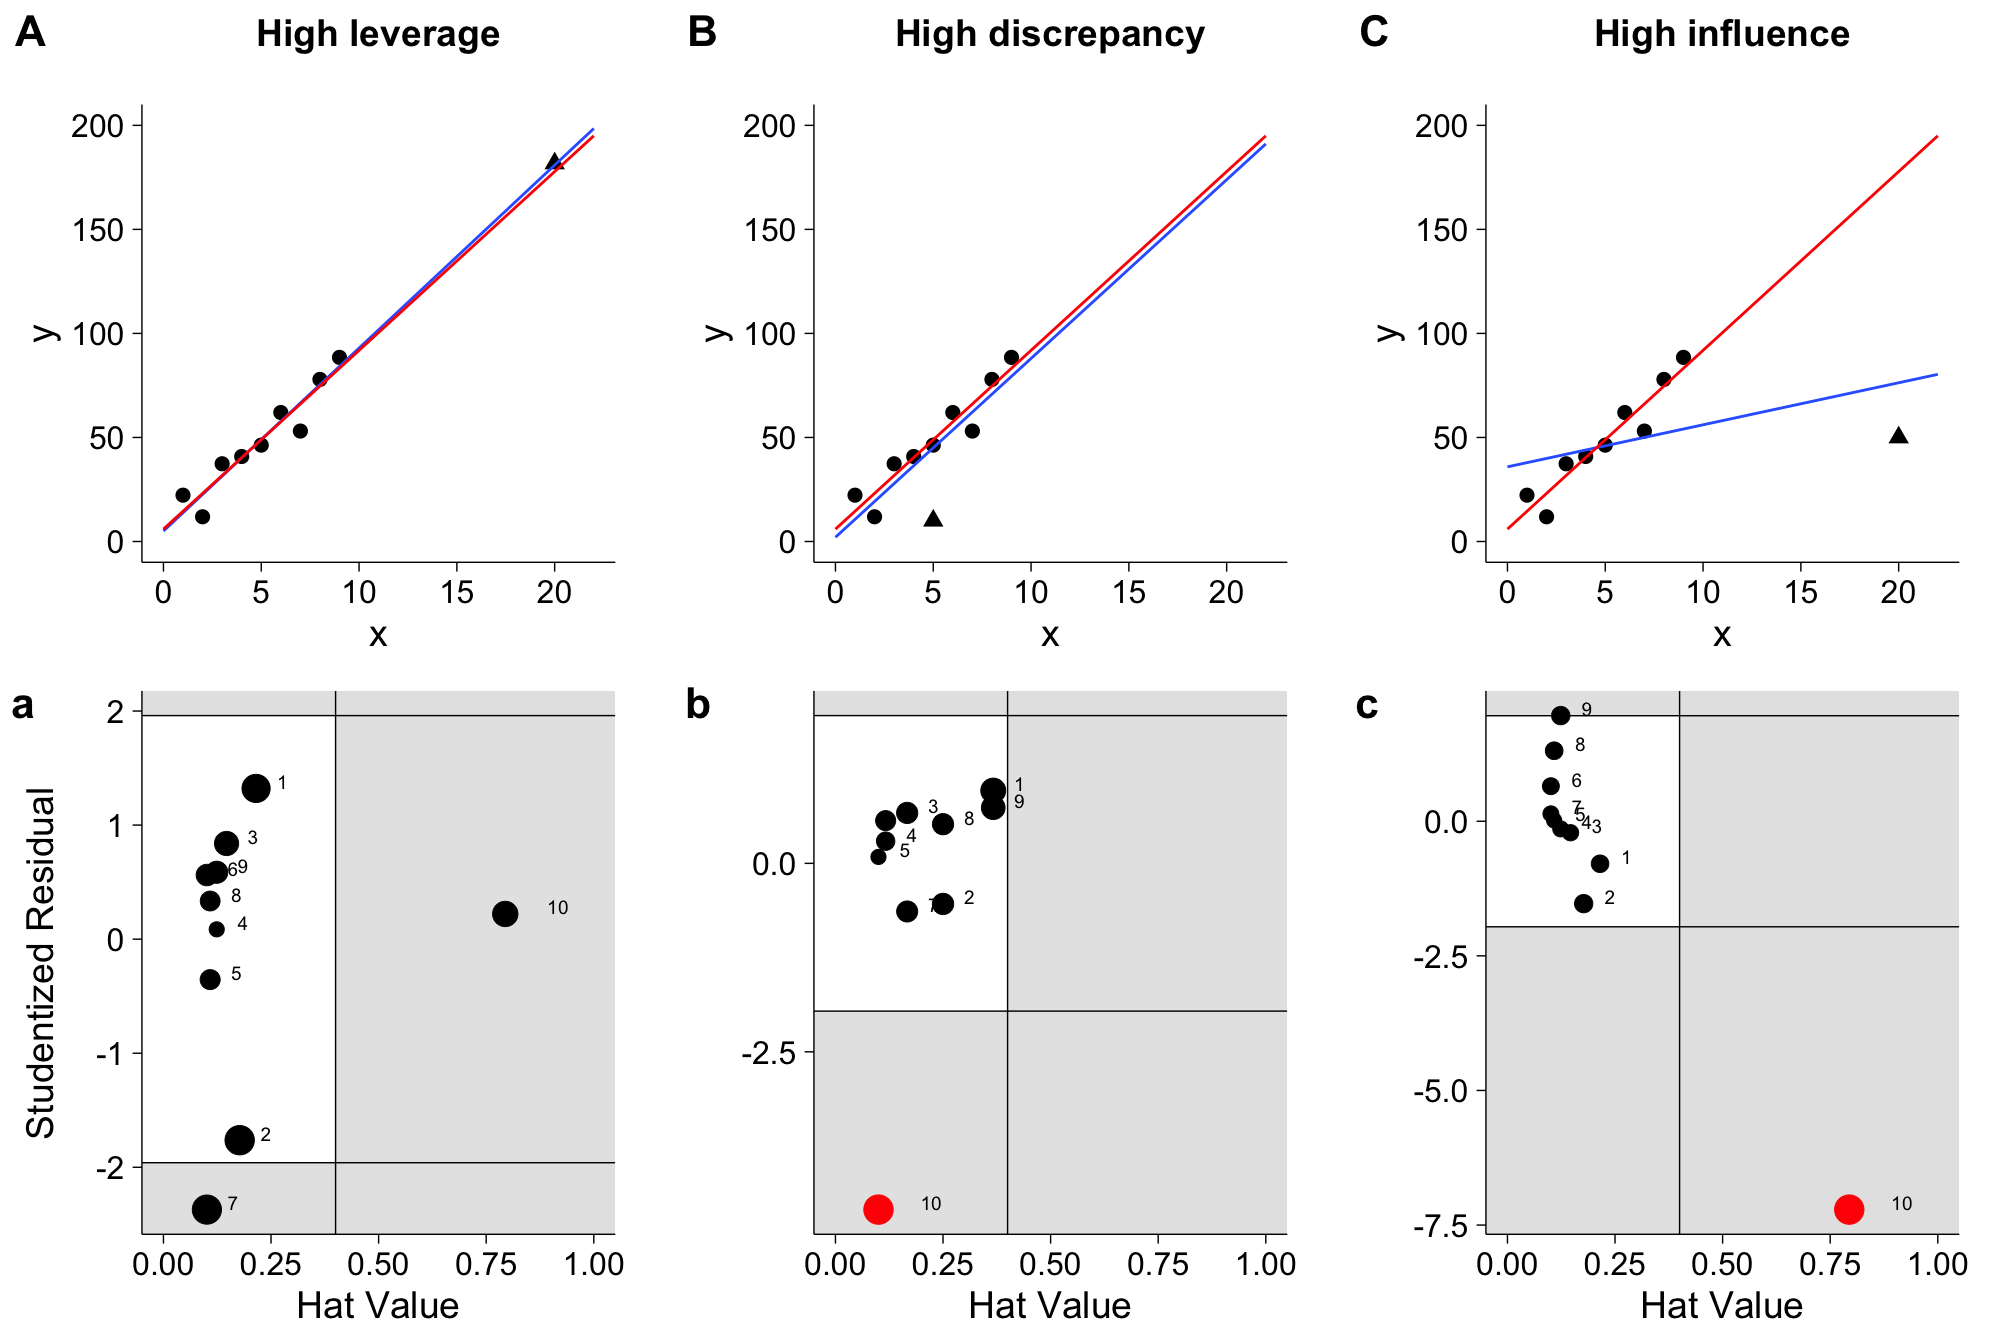
Let's analyze each case:
-
Case A: High Leverage (but Low Influence)
- Scatter Plot (A): Notice point 10 has an extreme x-value but lies perfectly on the trend of the other points.
- Diagnostic Plot (a): Point 10 is far to the right, indicating a high Hat Value (high leverage). However, its Studentized Residual is almost zero, so it's close to the horizontal line. It has potential, but it's not influential.
-
Case B: High Discrepancy (Outlier, but Low Influence)
- Scatter Plot (B): Point 10 has a normal x-value but a very unusual y-value. It's a classic outlier.
- Diagnostic Plot (b): Point 10 has a very large negative residual, placing it at the bottom of the plot. But its Hat Value is low, so it's on the left side. It pulls on the line, but its low leverage limits its influence.
-
Case C: High Influence
- Scatter Plot (C): Point 10 has both an extreme x-value AND an unusual y-value. It single-handedly tilts the regression line.
- Diagnostic Plot (c): This is the danger zone. Point 10 is in the bottom-right corner of the plot. It has a high Hat Value (leverage) and a large negative residual. It is correctly identified as an influential point (marked in red), as it would almost certainly fall outside the Cook's distance contours.
A Realistic Exam Example
Now look at a typical plot you might get from R.

How to Interpret This Plot for an Exam:
- Scan for points outside the Cook's Distance lines. In this plot, no point crosses the dashed red lines (labeled 0.5 and 1).
- Formulate your conclusion. "There are no highly influential points in this model, as no observation falls outside the Cook's distance contours."
- Identify points of interest (if asked). "Observation 14 has the highest leverage, but its residual is small, so its influence is limited. Observation 10 has a large negative residual but low leverage. Neither is influential enough to be a major concern."
For a deeper dive into the specific numerical cutoffs that a strict professor might appreciate, the following resource is useful.
Linear Regression Assumptions and Diagnostics in R
This article from STHDA provides the specific formulas and rules of thumb for identifying high-leverage and influential points.
Read the sections Outliers and high leverage points and Influential values. Note the rules of thumb for high leverage (hat-value > 2(p+1)/n) and high influence (Cook's distance > 4/(n-p-1)). You likely won't need to calculate these, but knowing they exist shows a deeper understanding.
Practice Drill
You are given the 'Residuals vs. Leverage' plot from Case C above. Your professor asks you to "Identify and interpret observation 10."
Write a 2-line exam-style answer.
Solution
Exam-Style Answer:
Observation 10 is a highly influential point. It exhibits both high leverage (an extreme predictor value, placing it far to the right) and a large residual (placing it far from the horizontal axis), causing it to have a large Cook's distance.
Conclusion
You have now mastered the interpretation of the single most important plot for identifying problematic data points. Your ability to quickly diagnose leverage and influence will be a significant asset in your exam.
Key Takeaways for Your Exam:
- The Plot: Residuals vs. Leverage.
- The Goal: Find points in the top-right or bottom-right corners.
- The Litmus Test: Does any point cross the dashed Cook's Distance line?
- The Interpretation: A point is influential if it has a dangerous combination of high leverage (extreme X) and a large residual (big error).
This lesson concludes our section on advanced diagnostics. Our next and final lesson will be a rapid-fire review of all topics and a mock practical paper to get you fully prepared for your exam.