Welcome to the final lesson in our module on the ANOVA table. In the previous lesson, we established the "why" behind the F-test by defining its null and alternative hypotheses. You now know that this test is designed to check if your regression model has any predictive value at all.
Today, we will focus on the "how" of making a decision. You will learn to use the F-statistic and its corresponding p-value, which you can find in any standard regression output, to determine your model's overall significance. Mastering this will allow you to write a precise, confident conclusion—exactly what's needed for your exam.
The Decision Rule: Using the P-value
In the last lesson, you learned that the F-statistic tests the null hypothesis () that all slope coefficients are zero against the alternative () that at least one is not. The F-statistic itself measures how much more variance the predictors explain compared to the unexplained variance. A larger F-statistic suggests that the predictors are useful.
But how large is "large enough"? The p-value gives us the direct answer.
The p-value tells us the probability of observing an F-statistic as large as or larger than the one we calculated, assuming the null hypothesis is true (i.e., assuming the predictors are useless).
Therefore, the decision rule is simple and is a cornerstone of hypothesis testing:
- If the p-value is less than your chosen significance level (, typically 0.05), you reject the null hypothesis.
- If the p-value is greater than or equal to , you fail to reject the null hypothesis.
This blog post from Quantifying Health offers a very clear and direct summary of this rule.
Understand the F-statistic in Linear Regression – QUANTIFYING HEALTH
This article gets straight to the point of interpreting the F-statistic's p-value.
Focus on the two bullet points at the very beginning of the article, under the heading. These two sentences are the core of what you need to know for your exam.
Applying the Rule: An Exam-Style Interpretation
Let's apply this rule. Imagine your R output gives you the following ANOVA table.

Here is how you would interpret this for your exam:
- Locate the values: In the "Regression" row, the F-statistic is 57.87 and the p-value is 0.000.
- Apply the rule: The p-value (0.000) is less than the standard significance level of .
- State the decision: We reject the null hypothesis ().
- Write the conclusion: Formulate a precise, two-part sentence.
Exam-Style Answer:
The p-value associated with the overall F-statistic is 0.000, which is less than the significance level of 0.05. Therefore, we reject the null hypothesis and conclude that the regression model is statistically significant, indicating that at least one predictor variable has a significant linear relationship with the response variable.
Watch the following video clips to see this interpretation process in action. The first clip quickly states the decision rule using the p-value, and the second frames the interpretation as an answer to a specific question.
Multiple Regression | ANOVA Table | F-Test | R-square | Standard Error
This video by Joshua Emmanuel shows how to use the p-value from software to make a clear decision.
Watch the short segment from this clip, where he compares the p-value to alpha and states the conclusion about the model's significance.
Multiple Regression - Interpretation (3of3)
In this clip, Pat Obi demonstrates how to frame the F-test interpretation as a direct answer to an exam-style question.
Pay attention to how he answers "question three" from this segment. He clearly states the hypotheses, references the F-statistic and p-value, and provides a definitive conclusion.
Common Exam Traps and Deeper Insights
Your professor will likely test your understanding beyond a simple interpretation. Here are two critical scenarios to master.
Trap 1: Significant Individual Predictor, but Non-Significant Model
Imagine you have many predictors, and just one happens to have a p-value < 0.05. Should you trust it? The F-test provides a crucial safeguard. With a significance level of 5%, you have a 1-in-20 chance of finding a "significant" relationship that is purely due to random chance. If you test many variables, the probability of finding at least one false positive increases dramatically.
The F-test assesses the model globally and accounts for the number of predictors, protecting you from this statistical illusion. If the F-test p-value is not significant, you should not trust any individual "significant" t-tests. The model as a whole is not useful.
The next reading explains this "multiple comparisons problem" clearly.
Understand the F-statistic in Linear Regression – QUANTIFYING HEALTH
This section of the Quantifying Health article explains why the F-test is a necessary "gatekeeper" before you look at individual predictors.
Read the section titled "Why do we even need the F-test?". The key takeaway is that the F-statistic adjusts for the number of variables, preventing you from being misled by chance findings.
Trap 2: Significant Model, but No Significant Individual Predictors
This is a classic exam scenario that often points to multicollinearity. This occurs when your predictor variables are highly correlated with each other. If two predictors contain redundant information, the model struggles to attribute the effect on the response variable to either one individually.
As a result, their individual standard errors increase, their t-statistics decrease, and their p-values become large (non-significant). However, collectively, they still do a good job of explaining the response variable, so the overall F-test is significant.
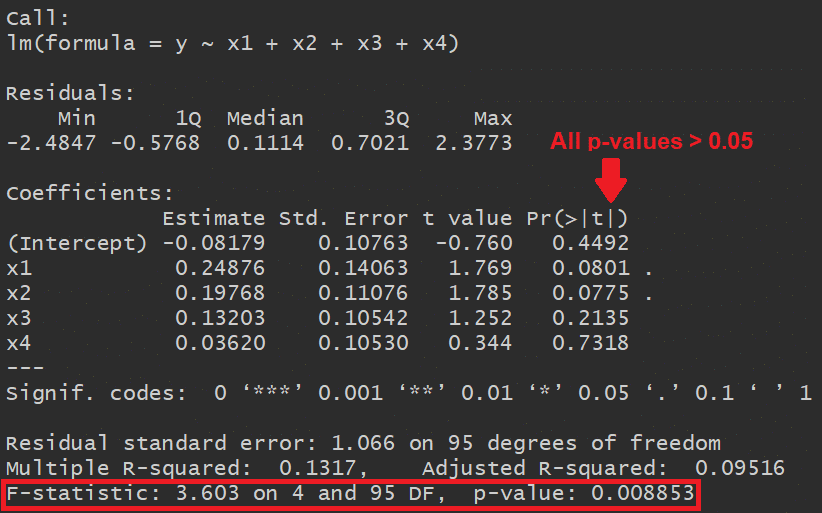
Look at this R output. The F-statistic is significant (p = 0.008853), but all individual p-values for the predictors are greater than 0.05.
The following reading explains exactly why this happens.
Understand the F-statistic in Linear Regression – QUANTIFYING HEALTH
This final section of the article addresses the "significant F, non-significant t's" paradox.
Read the section titled "What if the F-statistic has a statistically significant p-value but none of the coefficients does?" This is a crucial concept for your exam.
Exam-Style Answer for this scenario:
The overall F-test is significant (p < 0.05), indicating the model is useful. However, no individual predictor is significant. This pattern strongly suggests the presence of multicollinearity, where correlated predictors make it difficult to isolate their individual effects, inflating their p-values.
Practice Drill
Let's put it all together. The following example involves predicting fuel consumption from four predictors.
Chapter 22 ANOVA Tables and F Tests | Foundations of Statistics
This resource provides a fully worked-out example of completing and interpreting an ANOVA table.
Locate the example titled Fuel consumption (continued) in Section 22.4. You'll see a completed ANOVA table and the interpretation of the F-statistic and its p-value.
Your Task:
Based on the "Fuel consumption" example you just read:
- What are the F-statistic and the p-value for the overall model?
- Using a significance level of , what is your decision regarding the null hypothesis?
- Write a complete, exam-style sentence to summarize your conclusion.
Solution
-
Values: The F-statistic is 11.99. The p-value is , which is essentially 0.0000009331.
-
Decision: The p-value is extremely small, far less than 0.05. We reject the null hypothesis.
-
Exam-Style Conclusion: The p-value for the overall F-statistic is approximately , which is well below the significance level of 0.05. Therefore, we reject the null hypothesis and conclude that the model is statistically significant, meaning at least one of the predictors (dlic, tax, inc, road) has a significant linear relationship with fuel consumption.
Conclusion
You have now completed the journey through the ANOVA table. You can deconstruct it, derive any missing value, and, most importantly, interpret the final result of the overall F-test.
Key Takeaways:
- The p-value of the F-statistic is the primary tool for assessing overall model significance.
- If p < , the model is statistically significant. At least one predictor is useful.
- If p , the model is not statistically significant. As a whole, the predictors do not explain the response variable.
- The F-test acts as a gatekeeper: if it is not significant, you should not rely on individual t-tests. If it is significant, you can proceed to examine the individual predictors.
In the next module, we will shift our focus from assessing the model to diagnosing its health. We will learn to use residual plots to check if the core assumptions of linear regression—like linearity and constant variance—have been met.