In our last session, we focused on the 'Sum of Squares' column of the ANOVA table, establishing the fundamental relationship that the total variation (SST) in your data can be split into explained variation (SSR) and unexplained variation (SSE). This principle, , is the first key to unlocking any partial regression output you'll face on your exam.
Today, we complete the puzzle. We will build out the rest of the ANOVA table by incorporating degrees of freedom (df), mean squares (MS), and the F-statistic. Your goal for this lesson is purely practical: to master the formulas connecting these components so you can confidently calculate any missing value from a partial ANOVA table. This "reverse engineering" skill is a high-frequency task on practical exams.
Deconstructing the ANOVA Table: The Formulas
The ANOVA table is a systematic way to present the results of partitioning the variance. We've handled the Sum of Square column. Let's add the remaining three: df, Mean Square, and F.
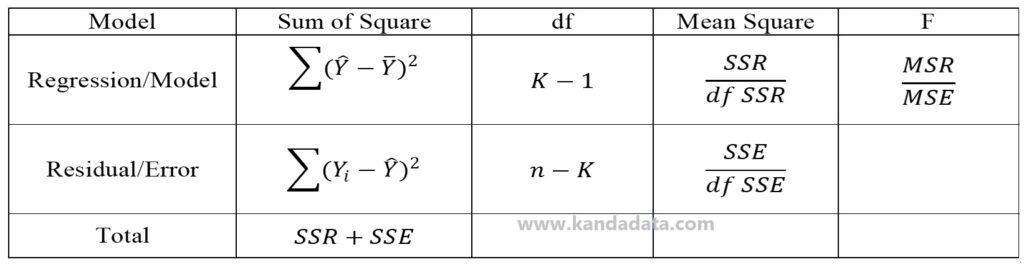
Let's walk through each column's formulas. For clarity, we will use to represent the number of predictor variables, which is equivalent to in the table above.
1. Degrees of Freedom (df)
Degrees of freedom represent the number of independent pieces of information available to estimate a parameter. For the exam, you just need to know the formulas:
- df Regression:
- df Residual/Error:
- df Total:
Just like the Sum of Squares, degrees of freedom are additive. This gives you a second crucial formula for derivations:
()
2. Mean Squares (MS)
A "Mean Square" is simply a "Sum of Squares" value divided by its corresponding degrees of freedom. It represents an average variation.
- Mean Square Regression (MSR):
- Mean Square Error (MSE):
Exam Tip: The MSE is a particularly important value. It is the unbiased estimate of the variance of the model's errors (). The square root of MSE is the Residual Standard Error (RSE) of the model.
3. The F-statistic
Finally, the F-statistic is the ratio of the two mean squares. Its purpose is to test if at least one predictor variable in your model is significant. We'll cover the interpretation in the next lesson; for now, focus on the calculation.
- F-statistic:
The Strategy: Reverse Engineering a Partial Table
With these formulas, you can solve for any missing value. The process is a logic puzzle. You look at what you're given and find the formula that connects it to what you need.
The following video provides an excellent, practical demonstration of this exact process. The presenter methodically fills in a partial regression output, including the ANOVA table, using the same formulas we've just discussed.
Multiple Regression Output - Finding Missing Values (Excel)
This video from Joshua Emmanuel is a perfect drill for your exam. It walks through the logic of finding missing values in a standard regression output.
Watch the following segments carefully, noting the step-by-step logic: Calculating Degrees of Freedom: See how n (observations) and k (predictors) are used to find all three df values. Finding MSE from F and MSR: A great example of using a formula "in reverse." Deriving SSR and SSE: Notice how SS = MS * df. This is a direct application of the Mean Square formulas. The video also uses the SST = SSR + SSE rule.
To reinforce these calculations, you can also review the worked examples in the resources below. They show the same principles applied in a textbook format.
Chapter 22 ANOVA Tables and F Tests | Foundations of Statistics
This textbook chapter formally presents the ANOVA table and its components.
Focus on the section "Analysis of Variance (ANOVA)", which defines MSR and MSres. Then, review the generic ANOVA table structure provided. Finally, look at the "Fuel consumption (continued)" example. Don't worry about the context; just trace how each value in the final table (SStot, SSres, SSreg, MSres, MSR, F) is calculated from the initial information.
Example Problems on Regression and ANOVA
This resource contains a direct, exam-style problem.
Review the problem under the heading "4. a.". This is another perfect illustration of starting with a partial table and using the core formulas to fill in the blanks for SSE, df, MSE, and the F-ratio.
Practice Drill
Now it's your turn. This is exactly the kind of question you can expect on your exam.
You are given the following partial ANOVA table from a simple linear regression analysis with a sample size of 16 observations.

Your Tasks:
- Determine the degrees of freedom for Regression, Error, and Total.
- Calculate the Sum of Squares for Regression (SSR) and Error (SSE).
- Calculate the Mean Square Error (MSE).
- Calculate the F-statistic.
Take a few minutes to solve it on your own before checking the solution.
Solution
Here is the step-by-step process to complete the table.
- Given Information:
- Sample size
- Simple linear regression, so number of predictors
- MSR = 309.9
- SST = 995.95
-
Calculate Degrees of Freedom (DF):
- DF Regression:
- DF Total:
- DF Error: (Alternatively, )
-
Calculate Sum of Squares (SS):
- SSR (Regression): We know . Therefore, .
- SSE (Error): We know . Therefore, .
- SSR (Regression): We know . Therefore, .
-
Calculate Mean Square (MS):
- MSE (Error): We know .
- MSE (Error): We know .
-
Calculate F-statistic:
- F: We know .
- F: We know .
Completed ANOVA Table:
| Source | DF | SS | MS | F |
|---|---|---|---|---|
| Regression | 1 | 309.90 | 309.9 | 6.324 |
| Error | 14 | 686.05 | 49.004 | |
| Total | 15 | 995.95 |
Conclusion
You have now assembled the complete ANOVA table. You have the formulas and the logical steps needed to derive any missing component from a partial output. This is a critical mechanical skill for your exam.
Key Takeaways:
- The ANOVA table is built on a few core relationships:
- Sums of Squares:
- Degrees of Freedom:
- Mean Squares:
- F-statistic:
- Reverse engineering is a process of elimination: identify what you have, identify what you need, and find the formula that connects them.
In our next lesson, we will shift from calculation to interpretation. You will learn how to use the F-statistic and its corresponding p-value to test the overall significance of your model and write a concise, exam-ready conclusion about whether your model is useful or not.