Hello. In the previous lesson, SELECT and FLOW showed why a trial result needs its treatment, population, comparison, and outcome attached. Weight-loss graphs need a similar qualification: when was weight measured, and was treatment still being taken?
This lesson follows weight during semaglutide treatment and after withdrawal. You will use two studies to distinguish a group’s average trajectory from an individual’s likely course—and a measured period of regain from an assumption about what happens forever.
Continuing treatment versus switching to placebo
STEP 4 offers a particularly direct comparison. Everyone first received weekly semaglutide during a 20-week run-in. Those who completed that phase had lost an average of 10.6% of their starting body weight. They were then randomly assigned either to continue semaglutide or to switch to placebo for another 48 weeks. The randomization therefore tested what happened after an initial period on treatment; it did not compare starting semaglutide with never starting it.
Read the trial’s concise report of that comparison before looking at the graph.
Read the STEP 4 trial report for its randomized comparison and the limits of the population to which it applies.
In the abstract near the top of the article, find “Results.” Read the main comparison, beginning with the 803 people randomized after the run-in and ending at the reported weight changes. Then read the conclusion under “Conclusions and Relevance.” Notice that both passages specify completion of the run-in.
From week 20 to week 68, mean body weight changed by −7.9% in the continuation group and +6.9% in the switch-to-placebo group. The between-group difference was −14.8 percentage points (95% confidence interval, −16.0 to −13.5 percentage points). These percentages describe change over the post-randomization period, not change from the start of the trial.
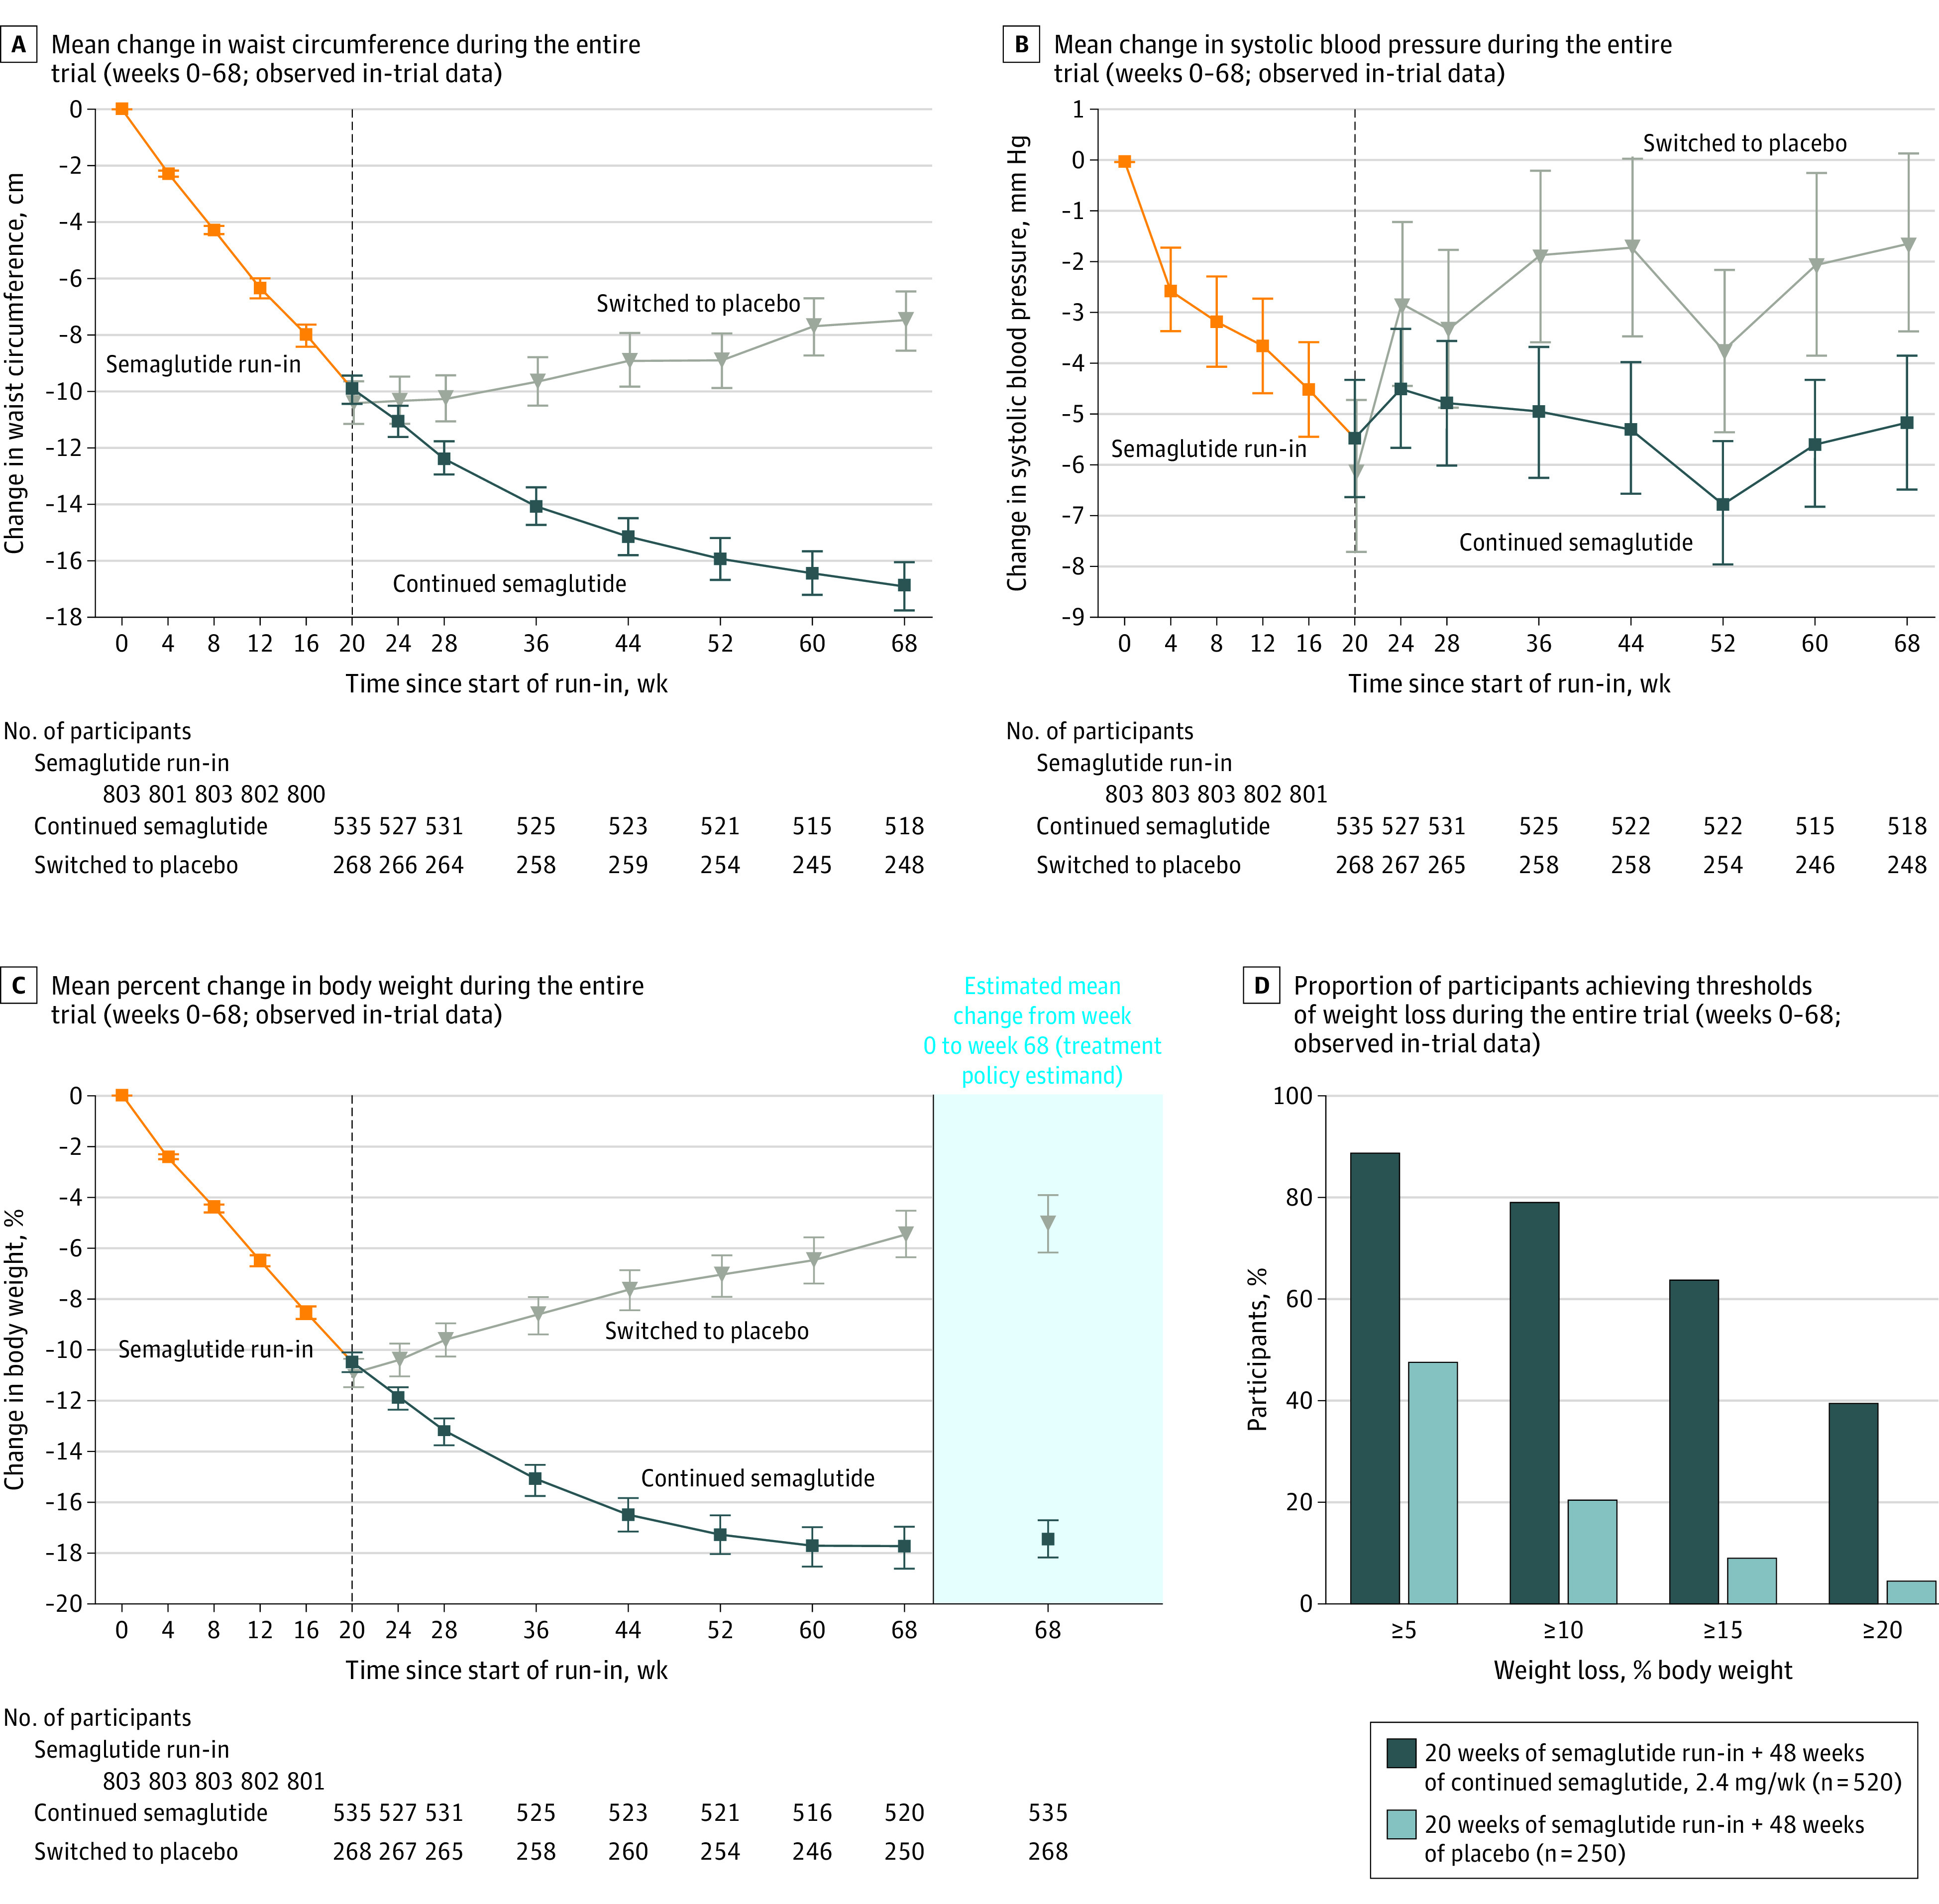
The rising line after the switch is regain, not necessarily a return to starting weight. Conversely, the falling continuation line shows an average benefit over the observed 48 weeks, not a guarantee that weight will keep falling indefinitely. Panel D makes another distinction visible: even within each assigned group, participants did not all reach the same weight-loss threshold.
STEP 4’s randomized contrast supports a causal conclusion for people like those randomized: among participants who completed 20 weeks of semaglutide run-in, continuing it produced a substantially different average weight trajectory from switching to placebo. Because randomization happened after that run-in, the result should not be presented as the guaranteed response of everyone who begins treatment.
What a year after withdrawal showed
STEP 1 followed a different sequence. Participants received 68 weeks of semaglutide or placebo alongside structured lifestyle intervention. An extension then observed a subset for 52 more weeks after treatment and the structured lifestyle intervention ended. This gives a longer view after stopping, though it is not the same experiment as STEP 4: its withdrawal period differed, and its extension included only some original participants.
Read the STEP 1 extension’s weight results to track each measurement against the same starting point.
In “3.2 Change in body weight and BMI,” read the opening paragraph, from the treatment results through the remainder of that final sentence, which ends “in the placebo arm,” immediately before “FIGURE 1.” Focus on the three timescales: baseline to week 68, week 68 to week 120, and baseline to week 120. You can leave the detailed cardiometabolic rows of Table 2 for another occasion.
In the extension group previously assigned semaglutide, mean weight loss by week 68 was 17.3% of starting weight. Over the next 52 weeks off treatment, participants regained an average of 11.6 percentage points of starting weight—roughly two-thirds of the earlier loss. At week 120, their mean weight was still 5.6% below starting weight.
The units matter. “Regained 11.6 percentage points” does not mean they regained 11.6% of their week-68 weight. Using a hypothetical 100 kg starting weight to picture the reported averages, a 17.3% loss would put weight at about 82.7 kg; regain amounting to 11.6% of the original 100 kg would put it near 94.3 kg. This is only an illustration of group averages, not an individual forecast. The study’s reported net mean loss is 5.6%; do not expect rounded figures from different observed measurements to reconcile exactly.
Regain was substantial, but “everyone regained everything” is also incorrect. At week 120, 48.2% of the previously semaglutide-treated extension participants still had weight loss of at least 5% from baseline. That proportion had fallen markedly from the end of treatment. Both facts belong in an accurate account.
Reading the curve without extending it beyond the data
A trajectory shows measurements within its observation window. STEP 1’s authors noted that average regain appeared to slow near the end of follow-up, but could not tell whether weight would stabilize below baseline or continue moving toward it. They also describe variation between participants.
Return to the STEP 1 extension to separate observed variation from predictions beyond follow-up.
In “3.3 Change in body weight in participant subgroups,” read the opening paragraph from the subgroup pattern, then continue to the end of that paragraph, where the authors give subgroup averages. In “4 DISCUSSION,” find the paragraph beginning “Mean body weight data suggested a slowing of weight regain.” Read the follow-up caveat through its final sentence, ending “without longer follow-up.” Pay attention to what the observed curve cannot establish.
The studies fit together without being interchangeable:
- STEP 4 randomly tested continuing versus stopping after a shared run-in. Its strongest claim concerns the difference between those assigned groups over the following 48 weeks.
- STEP 1’s extension describes what happened during a year off treatment in a subset of participants. Treatment and structured lifestyle intervention had both ended, so its regain curve should not be attributed to drug withdrawal alone.
- Neither tells us a particular person’s eventual weight, or whether an apparent slowing near the end of follow-up is a permanent plateau.
These limits do not make the curves uninformative. Appetite and energy expenditure can respond to weight loss, and withdrawing an appetite-modifying drug can remove a continuing influence on food intake. But a plausible biological explanation does not replace the measured outcome, and an average does not eliminate differences between people. The appropriate interpretation is that weight regain after withdrawal was common and considerable in these studied groups, while its amount and longer-term course were not fixed for every individual.
Key takeaways
During the observed STEP 4 period, continuing semaglutide led to further average weight loss, whereas switching to placebo led to average regain. In the STEP 1 extension, participants previously assigned semaglutide regained much of their earlier loss during a year off treatment, yet the group remained below its starting weight on average. Always check the starting point for a percentage, who entered the analysis, what else changed at withdrawal, and where follow-up ends before interpreting a weight trajectory.
The next lesson turns from how much total body weight changes to what makes up that change: fat mass, lean mass, and why measured lean-mass loss is not automatically the same as lost skeletal muscle or impaired strength.