Introduction
In our last lesson, we mastered how to incorporate inflation into project appraisal, ensuring our NPV calculations reflect the real-world erosion of purchasing power. We worked with specific forecasts for cash flows, but as you know from your background in statistics, these are point estimates representing an expectation, not a certainty. What happens to our project's viability if those estimates are wrong? How much can our sales forecast fall, or our costs rise, before a profitable project turns into a loss-making one?
This lesson introduces sensitivity analysis, a fundamental risk analysis technique that answers these questions. It's a method to systematically test how sensitive our project's NPV is to changes in the key assumptions we've made. For the CB1 exam, and in professional practice, this is a crucial step beyond a simple NPV calculation, as it helps to quantify a project's risk profile and identify its most critical variables. Your learning outcome for today is to be able to perform sensitivity analysis on a project's NPV and interpret the results to identify these key variables.
What is Sensitivity Analysis?
At its core, sensitivity analysis measures the responsiveness of an output variable (in our case, NPV) to a change in an input variable (like sales volume, costs, or the discount rate). The process involves changing one input variable at a time, while holding all other assumptions constant, to isolate and measure its impact.
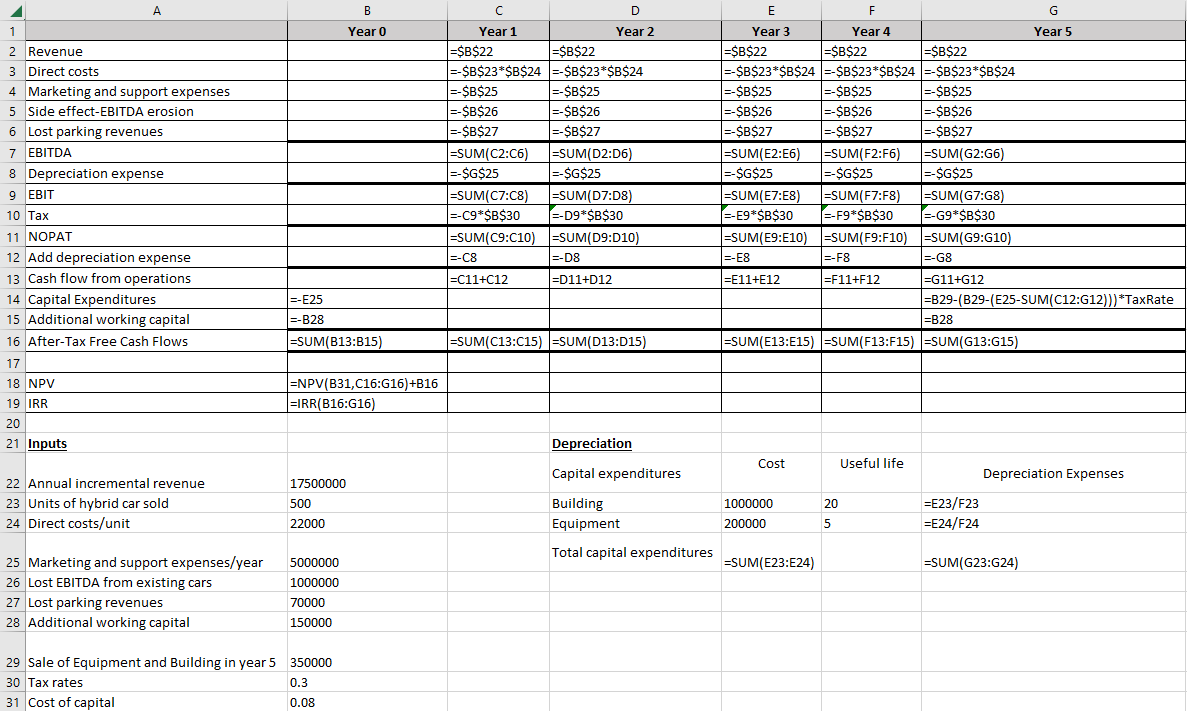
To begin, let's establish a formal definition and see how we can quantify this relationship.
NPV – Modelling and Analysis – Introduction to Financial Management
This reading from the University of Queensland introduces the concept and purpose of sensitivity analysis.
Please read the section titled Sensitivity analysis. Pay attention to the definition and the formula presented, which frames sensitivity as a slope: \frac{\Delta \text{NPV}}{\Delta \text{Input}}. This helps in understanding the direct relationship between a change in an input and the resulting change in NPV.
While thinking of sensitivity as a slope is conceptually useful, for exam purposes, we typically express it as the percentage change in a variable that would cause the project's NPV to fall to zero. This gives us a "margin of safety" for each of our assumptions.
Calculating and Interpreting Sensitivity
The most common way to calculate sensitivity is by using a straightforward formula that relates the project's total NPV to the present value of the cash flows affected by the variable in question.
The general rule is:
This percentage tells you by how much the variable can worsen before the project's NPV becomes zero. A low sensitivity percentage indicates a highly sensitive variable—meaning even a small adverse change could make the project unviable. Conversely, a high percentage suggests the NPV is robust to changes in that variable.
The following video provides a complete, step-by-step worked example that is perfectly aligned with the type of calculation required for the CB1 exam.
Investment Appraisal Under Uncertainty Sensitivity Analysis (example 1)
This excellent video from OpenTuition walks through a full sensitivity analysis problem, covering several key variables.
We will work through this video in stages. First, familiarise yourself with the concept and the base case calculation by watching from the beginning to the initial NPV calculation. Next, watch the core calculation sections from the main sensitivity calculations. Here, the presenter applies the general rule to several variables: Initial Investment: Notice that since this is a time 0 cash flow, its present value is the value itself. Sales Volume/Contribution: A change here affects the PV of the entire stream of annual contributions. Fixed Costs: A change here affects the PV of the entire stream of fixed costs. Finally, watch the section on interpretation from commenting on the results. This is critical for understanding what the numbers mean. Focus on the conclusion that the lower the sensitivity percentage, the more critical the variable.
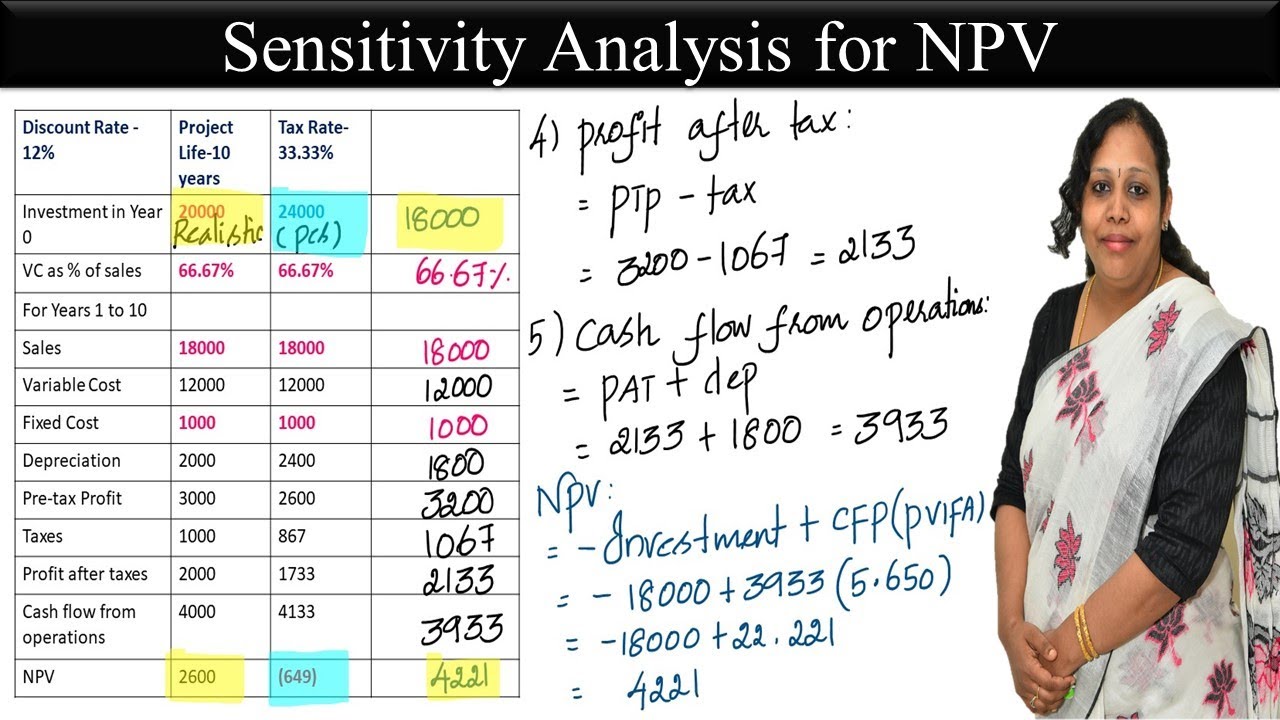
To summarise the interpretation:
- Sales Volume Sensitivity: 2.21%
This means if the annual sales volume falls by just 2.21%, the NPV will drop to zero. This is a very sensitive variable. - Fixed Costs Sensitivity: 6.08%
The annual fixed costs can increase by up to 6.08% before the NPV hits zero. This is less sensitive than sales volume, but still a key variable. - Scrap Value Sensitivity: 288.8%
The scrap value could fall by 288.8% (which is impossible, as it can't fall by more than 100%) before NPV is zero. This tells us the project is not at all sensitive to our scrap value estimate.
The Special Case: Sensitivity of the Cost of Capital
The general formula doesn't work for the discount rate. A change in the cost of capital doesn't affect one specific cash flow stream; it changes the present value of all future cash flows simultaneously.
So, how do we find the change in the discount rate that makes NPV = 0? You already know the answer from a previous lesson. The discount rate that results in an NPV of zero is, by definition, the Internal Rate of Return (IRR).
Therefore, to find the sensitivity of the project to the cost of capital:
- Calculate the project's IRR.
- Calculate the percentage difference between the IRR and the project's original cost of capital.
This tells you how much the cost of capital can increase before the project is no longer acceptable. Let's see this final piece of the puzzle in action.
Investment Appraisal Under Uncertainty Sensitivity Analysis (example 1)
This final clip from the OpenTuition video explains the unique method for calculating the sensitivity of the cost of capital.
Please watch from the cost of capital section. Note how the presenter immediately identifies this problem as an IRR calculation and then finds the percentage change from the original rate.
From Sensitivity to Break-Even Point
The sensitivity percentage is useful, but sometimes it's more intuitive to know the actual value of a variable at which the project breaks even (i.e., NPV = 0). We can easily derive this from our sensitivity analysis.
Let's return to the text resource, which demonstrates this calculation.
NPV – Modelling and Analysis – Introduction to Financial Management
This reading shows how to use the results of a sensitivity analysis to find the break-even point for an input variable.
Please read the part of the section calculating the break-even point. The example calculates the minimum net revenue per unit required for the project to have a non-negative NPV.
The logic is straightforward: if a 2.21% drop in sales volume wipes out our entire NPV, we can calculate what that sales volume is in absolute terms. This provides a clear, tangible target for managers to monitor. For instance, if the original sales estimate was 15,000 units, a 2.21% drop means the break-even sales volume is units.
Conclusion
Today, we've added a crucial layer of risk analysis to our capital budgeting toolkit. We moved beyond single-point forecasts and learned how to systematically measure a project's vulnerability to our own estimation errors. This process is not about finding the 'true' NPV, but about understanding the range of possible outcomes and identifying the project's weakest links.
Key Takeaways:
- Sensitivity analysis measures how a project's NPV changes in response to a change in a single input assumption.
- The standard calculation for most variables is .
- A lower sensitivity percentage signifies a more critical variable, as a small adverse change can make the project unprofitable.
- The sensitivity to the cost of capital is a special case. It is the percentage by which the cost of capital can rise to meet the project's IRR.
- The main limitation of this technique is that it only analyses one variable at a time, ignoring the possibility that multiple variables (like price and sales volume) might change together.
In our course so far, we have focused on how a company makes decisions about individual projects. In our next lesson, we will broaden our perspective to consider how companies grow and change at a corporate level, by exploring the motives and methods behind mergers, acquisitions, and corporate restructuring.