Introduction
In our last lesson, we explored profitability ratios, which measure a company's ability to generate profit from its sales and investments. We saw that a company can post impressive profits, but as you know from your background in statistics, a single number rarely tells the whole story. A profitable company that cannot pay its suppliers, employees, or lenders on time is a company in crisis. This brings us to our topic today: liquidity.
This lesson addresses a crucial question: does the company have sufficient short-term resources to meet its short-term obligations? We will move from the profitability focus of the income statement to the snapshot of assets and liabilities provided by the balance sheet. You'll learn to calculate and, more importantly, interpret the key ratios that analysts use to assess a company's short-term financial health. Given your preference for practical calculations, we will focus on the mechanics and interpretation of these numbers, using a sample balance sheet to bring the concepts to life.
What are Liquidity Ratios?
Liquidity refers to how easily an asset can be converted into cash without a significant loss in its value. Cash is the most liquid asset, while things like specialised machinery or a warehouse are highly illiquid. Liquidity ratios measure a company's ability to pay its debts that are due within one year (current liabilities) using assets that are expected to be converted into cash within one year (current assets).
These ratios are vital for lenders, suppliers, and managers. A supplier considering offering credit terms to a company will look at its liquidity ratios to gauge the risk of late payment. A bank will do the same before approving a short-term loan.
To build a solid foundation, let's start with a short reading that explains the purpose and importance of these metrics.
Liquidity Ratios: Key Types, Formulas & Examples
This article from Ramp provides a clear overview of what liquidity ratios measure and why they are a cornerstone of financial analysis.
Please read the first two sections, from the beginning of the article down to the end of the introduction to "Why liquidity ratios matter". This will frame the importance of the calculations we're about to perform.
The Three Key Liquidity Ratios
We will focus on three primary liquidity ratios, each offering a progressively more conservative view of a company's financial position. We will move from a broad measure to a very strict one.
The video below from Accounting Stuff provides an excellent, clear walkthrough of how to calculate each of these three ratios. The presenter uses a simple balance sheet to illustrate where the numbers come from.
3 Liquidity Ratios You Should Know
This video, "3 Liquidity Ratios You Should Know," clearly defines, calculates, and interprets the current, quick, and cash ratios.
Please watch the video from the introduction to understand the context. Then, watch the following segments which explain each ratio in sequence: Current Ratio: This is the most common and least conservative measure. Quick Ratio: A more stringent test that excludes inventory. Cash Ratio: The most conservative test, focusing only on immediate cash. Finally, watch the recap to solidify your understanding of the differences.
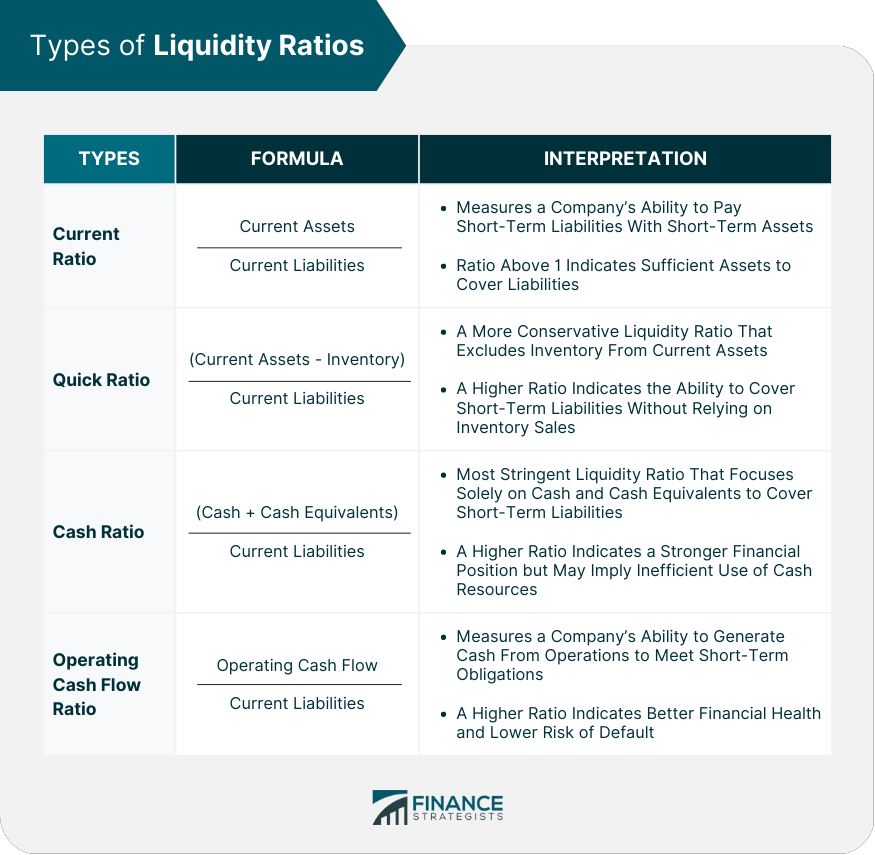
Let's summarise the formulas and their logic.
-
Current Ratio: This is the broadest measure of liquidity.
It compares all assets expected to become cash within a year to all liabilities due within a year. A ratio of 1.5 to 2.0 is often considered healthy, but this varies significantly by industry. A ratio below 1.0 suggests the company may not have enough liquid assets to cover its short-term liabilities.
-
Quick Ratio (or Acid-Test Ratio): This ratio provides a more conservative measure by excluding inventory from current assets. Inventory is often the least liquid current asset and may have to be sold at a discount in a hurry.
A quick ratio of 1.0 or greater is generally preferred, as it indicates the company can meet its current liabilities without relying on the sale of its inventory.
-
Cash Ratio: This is the "acid test of the acid test," the most stringent liquidity ratio. It measures the ability of a company to pay its current liabilities using only cash and cash equivalents.
This ratio shows a company's ability to weather a sudden crisis where revenue dries up and credit is frozen. There isn't a common target for this ratio, but a very low figure (e.g., below 0.5) could be a warning sign.
A Worked Example: Analysing Company 1
As we've established, ratios are most powerful when used to analyse trends over time. Let's apply what you've learned to a practical example. Below is the balance sheet for "Company 1" for four years. We will calculate the current and quick ratios for the two most recent years, 2019 and 2020, to assess the trend in its liquidity.
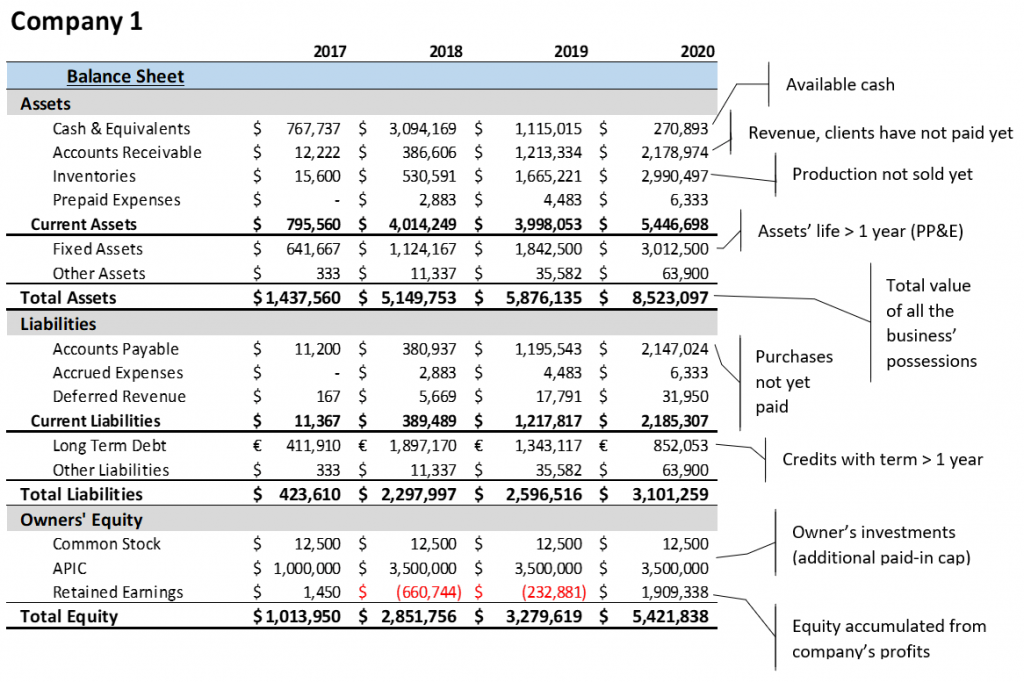
First, let's identify the necessary figures from the balance sheet for 2020 and 2019.
For 2020:
- Current Assets: $5,446,698
- Current Liabilities: $2,185,307
- Inventories: $2,990,497
For 2019:
- Current Assets: $3,998,053
- Current Liabilities: $1,217,817
- Inventories: $1,665,221
Now, let's perform the calculations.
Current Ratio Calculation
- 2020:
- 2019:
Interpretation: The current ratio has decreased from 3.28 in 2019 to 2.49 in 2020. While a ratio of 2.49 is still very strong and suggests the company has ample capacity to cover its short-term debts, the downward trend is noteworthy. It indicates that its liquidity position, by this measure, has weakened over the year.
Quick Ratio Calculation
- 2020:
- 2019:
Interpretation: The quick ratio has also seen a significant decline, from a very strong 1.92 to a more modest 1.12. A ratio of 1.12 is still healthy (above the 1.0 benchmark), but the sharp drop merits investigation.
Overall Analysis:
Both ratios show a deterioration in Company 1's liquidity between 2019 and 2020. The large gap between the current ratio (2.49) and the quick ratio (1.12) in 2020 reveals that a substantial portion of the company's current assets is tied up in inventory ($2,990,497 out of $5,446,698, or about 55%). This reliance on inventory to meet short-term obligations has increased significantly since 2019, when inventory was only 42% of current assets. An analyst would want to investigate if the company is struggling to sell its stock.
Limitations and Context
It is crucial to remember that ratios are not absolute indicators of performance. They are tools for analysis that require context.
[PDF] December 2022 Examination INDICATIVE SOLUTION
This document from the Institute and Faculty of Actuaries provides insight into what examiners look for in ratio analysis.
Please read section (ii) of Solution 11. Focus on the bullet points starting from the first point. This highlights several key limitations that are critical to mention in an exam context.
As the reading suggests, here are some key limitations:
- Snapshot in Time: Ratios are calculated using year-end figures, which may not be representative of the company's position throughout the year. Companies can engage in "window dressing" to make their accounts look better at the reporting date.
- Asset Quality: The balance sheet value of assets like inventory and accounts receivable might not be realistic. Some inventory may be obsolete, and some receivables may never be collected.
- Industry Benchmarks: A "good" ratio varies dramatically by industry. A supermarket with fast-moving inventory can operate safely with a low current ratio, while a manufacturer of large, expensive equipment would need a much higher one.
Conclusion
In this lesson, we have moved from measuring profitability to assessing short-term solvency. You have learned how to calculate the three main liquidity ratios and, more importantly, how to interpret them to evaluate a company's ability to meet its immediate financial obligations.
Key Takeaways:
- Liquidity measures a company's ability to pay its short-term debts.
- The Current Ratio is the broadest measure, comparing all current assets to current liabilities.
- The Quick Ratio (Acid-Test) is more conservative, excluding less-liquid inventory from the calculation.
- The Cash Ratio is the most stringent test, focusing only on cash and its equivalents.
- Analyzing the trend of these ratios over time is more insightful than looking at a single period.
- Liquidity ratios have limitations and must be interpreted in the context of the company's industry and specific circumstances.
Having covered profitability and now short-term liquidity, a logical next question arises: what about the company's long-term financial health? In our next lesson, we will explore gearing and coverage ratios, which measure a company's reliance on long-term debt and its ability to service that debt.