Welcome to the next lesson in our module on specialised accounts. In our previous session, we explored the regulatory world of insurance companies, focusing on Solvency II and the principles designed to protect policyholders. We saw that a core part of this regulation involves forcing insurers to hold a capital buffer, like the Solvency Capital Requirement, to withstand unexpected losses.
Today, we turn our attention from insurers to banks. While their business models differ, the fundamental regulatory concern is the same: ensuring the institution is financially robust enough to protect its customers. For banks, this means protecting their depositors. We will explore the primary tool used by regulators to measure a bank's financial strength: the Capital Adequacy Ratio (CAR). In line with your preference for practical application, this lesson is heavily focused on the calculation and interpretation of these crucial metrics. By the end of our session, you will be able to calculate a bank's key capital ratios and interpret what they mean for its stability.
The Core Purpose: Protecting Depositors' Money
Before we dive into any formulas, it's essential to understand why capital adequacy is so critical in banking. A bank's balance sheet is unique. Most of its funding comes not from its owners (equity) but from its customers in the form of deposits. These depositors entrust their money to the bank primarily for safekeeping, not to earn high returns or take significant risks.
The bank then uses this money to make loans and investments, which are its assets. However, these assets carry risk—borrowers might default, or investments might lose value. If a bank suffers significant losses on its assets, whose money is at risk? The regulatory framework is designed to ensure that the first to absorb any losses are the bank's owners and other capital providers, not the depositors.
The following video provides an excellent narrative on this fundamental principle. It visually explains the structure of a bank's balance sheet and clarifies why capital acts as a protective buffer for depositors.
Financial Statement Analysis for Banks
This first segment from the "Financial Statement Analysis for Banks" video introduces the concept of capital adequacy and its primary goal.
Please watch from the beginning. The speaker uses a simple balance sheet analogy to explain why depositors must be protected and who should bear the losses when a bank's assets lose value. Pay close attention to the idea of capital being the buffer that absorbs these "burns."
Calculating Capital Adequacy: The Formula
As the video established, we need a way to measure if the capital buffer is "adequate" relative to the risks the bank is taking. This is done using the Capital Adequacy Ratio (CAR).
The basic formula is straightforward:

As you can see, the ratio is:
Let's break down the two main parts of this formula.
Denominator: Risk-Weighted Assets (RWA)
Your background in statistics makes the concept of RWA particularly intuitive. Instead of using total assets as the denominator, regulators use a risk-weighted figure. Each asset on the bank's balance sheet is assigned a risk weight based on its likelihood of default or loss. A loan to a government is less risky than an unsecured personal loan, so it receives a lower risk weight.
The RWA is the sum of all assets multiplied by their respective risk weights. For example:
- Cash might have a 0% risk weight.
- A government bond might have a 20% risk weight.
- A standard corporate loan might have a 100% risk weight.
The video we started with continues with a clear, step-by-step demonstration of how to calculate RWA for a sample bank.
Financial Statement Analysis for Banks
This next section of the same video provides a detailed, practical example of calculating a bank's Risk-Weighted Assets and then its overall CAR.
Please watch the segment from this point. The speaker takes the asset side of a balance sheet (Cash, Due from Central Bank, Loans, etc.) and assigns a risk percentage to each to arrive at the total RWA. This is a perfect example of the calculation in action.
Numerator: The Tiers of Capital
The numerator, "Total Capital," is also more nuanced than it first appears. Regulators classify a bank's capital into different "tiers" based on its quality, meaning its ability to absorb losses.
- Tier 1 Capital: This is the highest quality, "going-concern" capital. It can absorb losses without requiring the bank to cease operating. Its main component is Common Equity Tier 1 (CET1), which includes common shares and retained earnings—the true, permanent capital from owners.
- Tier 2 Capital: This is "gone-concern" capital. It can absorb losses in the event of a liquidation, providing a buffer for depositors after the bank has failed. It includes items like subordinated debt and certain reserves.
Because CET1 is the highest quality capital, regulators often focus on it specifically. Let's watch a short video that focuses on the CET1 ratio.
This concise video, "CET1 Ratio," focuses on the most critical capital measure and provides another clear example of an RWA calculation.
Please watch the entire video. It clearly defines CET1 capital as the "safeguard money" and then walks through another RWA calculation with different asset types, before calculating the final CET1 ratio.
Key Ratios and Interpretation
From this, we get three key capital ratios that regulators monitor:
- CET1 Capital Ratio = CET1 Capital / RWA
- Tier 1 Capital Ratio = Tier 1 Capital / RWA
- Total Capital Ratio = (Tier 1 + Tier 2 Capital) / RWA
The following reading from your CB1 course materials formally defines these ratios and provides a simple worked example.
[PDF] Subject CB1 - CMP Upgrade 2021/22 - Actuarial Education
This section from the official ActEd study material explains the structure of a bank's balance sheet and defines the key capital ratios.
Please read the section titled '3 Banking company accounts'. Start from the beginning of the section (the introduction) and pay close attention to the subsection that defines the CET1 capital ratio and provides a calculation example (the ratio definition and example).
Interpreting the Ratios: What is a "Good" Number?
Calculating a ratio is only half the battle. To interpret it, you must compare it to the minimum requirements set by international regulatory standards, known as the Basel Accords.
Regulators define specific thresholds. If a bank's ratios fall below these levels, it faces increasingly severe restrictions, a system known as Prompt Corrective Action (PCA).
The document below provides a detailed table of these thresholds. It is a powerful tool for interpretation, allowing you to classify a bank's capital adequacy level precisely.
[PDF] 3-Understanding-a-Bank-through-its-Financial-Statements-Sparks.pdf
This presentation clearly lays out the minimum capital ratios required under the Basel III framework.
Please review the slides titled: REQUIRED RATIOS (slide 50), which gives the absolute minimums. CAPITAL CONSERVATION BUFFER (slide 51), which introduces an additional buffer that banks must hold to avoid restrictions on paying dividends or bonuses. PROMPT CORRECTIVE ACTION FRAMEWORK (slide 53), which gives the crucial table defining categories from "Well Capitalized" down to "Critically Undercapitalized". This is the key to interpreting the ratios.
Using this framework, a bank with a CET1 ratio of 12%, a Tier 1 ratio of 13%, and a Total Capital ratio of 15% would be considered "Well Capitalized" and would face no restrictions. Conversely, a bank with a CET1 ratio of 5% would be classified as "Undercapitalized" and would be subject to regulatory intervention.
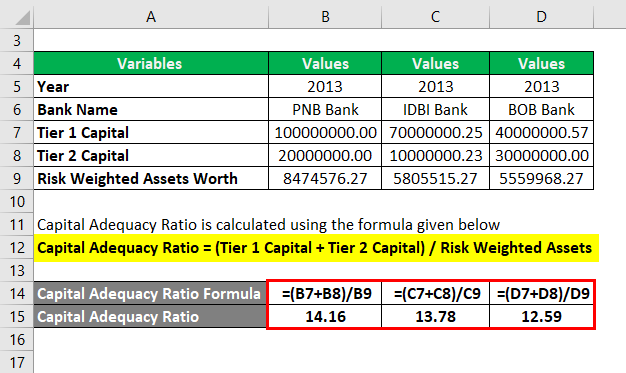
Here is an example showing the calculated ratios for three real-world banks. You can see how the formula is applied and that the resulting ratios are well above the minimums.
The Trade-off: Profitability vs. Safety
A bank's management might be tempted to increase profits by investing in riskier assets that offer higher returns. However, this action has a direct impact on capital adequacy. Higher-risk assets lead to a higher RWA, which in turn lowers the capital ratios, all else being equal. This creates a natural tension between the pursuit of profit and the need for regulatory compliance and safety.
The following exam-style question from your course materials explores this exact trade-off.
[PDF] Subject CB1 - CMP Upgrade 2021/22 - Actuarial Education
This short section presents a common scenario for interpreting bank accounts.
Please read the practice question and solution in section 13.6 Increasing the return on equity (read this section). It discusses several ways a bank could try to boost its profitability and explains why these actions could dangerously erode its capital ratios, potentially breaching regulatory guidelines.
This exercise demonstrates the true power of interpretation. It's not just about knowing the numbers, but understanding the strategic implications behind them and the delicate balance a bank must maintain between risk, return, and regulation.
Conclusion
Today we have focused on the quantitative heart of banking regulation. We have seen that while the business is complex, the core principle of protecting depositors is enforced through a clear, measurable set of capital adequacy ratios.
Key Takeaways:
- Capital Adequacy Ratios (CAR) are the primary measure of a bank's financial strength and ability to absorb losses.
- The fundamental formula compares a bank's Capital (the numerator) to its Risk-Weighted Assets (RWA) (the denominator).
- RWA reflects the total risk exposure of a bank's assets, with riskier assets receiving a higher weighting.
- Capital is divided into tiers based on quality, with Common Equity Tier 1 (CET1) being the highest quality. This leads to three key ratios: the CET1 Ratio, Tier 1 Ratio, and Total Capital Ratio.
- Interpretation involves comparing a bank's calculated ratios against regulatory minimums (defined by frameworks like Basel III) to determine if the bank is "Well Capitalized," "Adequately Capitalized," or worse.
In this lesson, we have focused on the "calculate and interpret" aspect. In our final lesson of this module, we will step back slightly to formally describe the key regulatory principles that govern bank accounts, focusing on the history and structure of the Basel Accords that underpin the ratios we learned about today.