Hello! Welcome back.
In our last lesson, we designed the abstract SignalGenerator class, creating a flexible, pluggable interface for our trading signals. This was a crucial architectural step. Now, we'll start building our first concrete signal generator, one that compares implied and historical volatility—a common technique for selling credit spreads.
Today's lesson focuses on the first half of that equation. Our learning outcome is to calculate the historical volatility of the underlying asset from recent price data. We will build a function that takes historical price data and returns a time series of annualized historical volatility, which will become a key input for our signal generator.
1. The Three Steps to Historical Volatility
Historical volatility (HV) is a backward-looking measure that quantifies how much an asset's price has fluctuated over a specific period. It is, fundamentally, the standard deviation of the asset's returns. The calculation process involves three main steps:
- Calculate daily returns: Determine the day-over-day percentage change in price.
- Calculate the standard deviation: Measure the dispersion of these returns.
- Annualize the result: Scale the daily volatility to an annual figure to make it comparable with other financial metrics, like the implied volatility (IV) of options.
Let's break these down.
Step 1: Calculating Logarithmic Returns
While you can use simple percentage change, it is standard practice in quantitative finance to use logarithmic (or "log") returns. They have several desirable mathematical properties, such as being time-additive. The formula is:
In Python with Pandas, this is straightforward. We can get a demonstration from the following video.
Python for Finance: Historical Volatility & Risk-Return Ratios
The video 'Python for Finance: Historical Volatility & Risk-Return Ratios' by QuantPy provides a concise walkthrough of the entire HV calculation process. We'll start with just the returns calculation.
Watch from 01:06 to 01:42. The presenter shows exactly how to compute log returns from a 'Close' price series in a Pandas DataFrame using np.log() and the .shift() method.
As you saw, the code is simply:log_returns = np.log(df['Close'] / df['Close'].shift(1))
Step 2: Calculating the Standard Deviation
With a series of daily log returns, the next step is to calculate their standard deviation using the .std() method in Pandas.
However, there's a subtle but important detail here concerning the "delta degrees of freedom" (ddof).
- Pandas'
.std()function defaults toddof=1, calculating the sample standard deviation. - NumPy's
.std()function defaults toddof=0, calculating the population standard deviation.
Since our historical data is just a sample of all possible price movements, the sample standard deviation (ddof=1) is the appropriate choice. This is a key detail for building a "foolproof" system, as using the wrong standard deviation can lead to small but meaningful differences in your calculations.
Calculating Historical Stock Volatility with Python and Excel
The video 'Calculating Historical Stock Volatility with Python and Excel' by Kevin Mooney clearly explains and demonstrates this discrepancy.
Watch from 05:34 to 08:17. The presenter discovers a difference between his NumPy and Pandas calculations and correctly identifies the ddof parameter as the cause. This is an excellent practical lesson in numerical precision.
Step 3: Annualizing the Volatility
The standard deviation we've calculated is a daily volatility. To make it comparable to option-implied volatility, we must annualize it. This is done by multiplying the daily volatility by the square root of the number of trading days in a year, which is typically assumed to be 252.

Let's see this final step implemented in code.
Python for Finance: Historical Volatility & Risk-Return Ratios
Returning to the QuantPy video, the presenter now annualizes the daily standard deviation.
Watch from 01:42 to 02:58. The presenter calculates the daily standard deviation and then multiplies it by np.sqrt(252) to get the final annualized volatility figure.
2. Calculating Rolling Historical Volatility
A single HV number for an entire multi-year dataset isn't very useful for generating timely trade signals. We need to know what the volatility has been recently. To do this, we calculate historical volatility over a rolling window (e.g., the last 20, 30, or 60 trading days).
Pandas makes this incredibly easy with the .rolling() method. We can chain it with .std() to get a rolling standard deviation, which we then annualize.
For a complete function that pulls these concepts together, let's refer to an article from PyQuant News.
How To Compute Volatility 6 Ways Most People Don't Know
The article 'How To Compute Volatility 6 Ways Most People Don't Know' provides an excellent, self-contained function for calculating rolling historical volatility based on the standard deviation of log returns.
Scroll down to the 'Standard Deviation' section and review the standard_deviation function. It cleanly encapsulates the three steps we've just discussed: calculating log returns, applying a rolling standard deviation, and annualizing the result.
Here is a Python function adapted from that example, which you can add to a new file in your project, framework/analytics.py:
# In framework/analytics.py

import numpy as np
import pandas as pd
import math

def calculate_historical_volatility(
    price_data: pd.Series,
    window: int = 21,
    trading_periods: int = 252
) -> pd.Series:
    """
    Calculates the annualized historical volatility over a rolling window.

    Args:
        price_data (pd.Series): A pandas Series of closing prices, indexed by date.
        window (int): The rolling window period in days. Default is 21 (approx 1 month).
        trading_periods (int): The number of trading periods in a year. Default is 252.

    Returns:
        pd.Series: A pandas Series of annualized historical volatility.
    """
    if not isinstance(price_data, pd.Series):
        raise TypeError("price_data must be a pandas Series.")

    # Calculate logarithmic returns
    log_returns = np.log(price_data / price_data.shift(1))

    # Calculate rolling standard deviation of log returns
    rolling_std = log_returns.rolling(window=window, center=False).std()

    # Annualize the standard deviation
    annualized_volatility = rolling_std * math.sqrt(trading_periods)

    return annualized_volatility.dropna()
Note: A common window is 21 days, representing the approximate number of trading days in a month.
3. A More Robust Approach: SMA vs. EWMA Volatility
The .rolling() function calculates a Simple Moving Average (SMA) of the volatility. Every data point in the window is weighted equally. This has a significant drawback known as the "ghosting" or "leverage effect." A single large price shock will keep the calculated volatility high for the entire duration of the window, and then cause a sudden, artificial drop when it finally falls out of the window.
A more robust and responsive method is the Exponentially Weighted Moving Average (EWMA). EWMA assigns more weight to recent data, causing the volatility estimate to react faster to new information and decay more smoothly from old shocks.
Estimate Volatility with SMA and EWMA in Python
The article 'Estimate Volatility with SMA and EWMA in Python' provides an excellent explanation of this exact problem and presents EWMA as the solution.
Read the sections 'An Introduction to Simple Moving Averages' and 'Exponentially Weighted Moving Averages'. Focus on the explanation of the 'leverage effect' pitfall of SMAs and how the weighting scheme of EWMA addresses it.
Fortunately, Pandas also has a built-in method for this: .ewm(). We can modify our function to optionally use this more advanced method. The span parameter in .ewm() is roughly comparable to the window in .rolling().
Here is an enhanced version of our function. For your "foolproof" system, using the ewma method is generally preferable.
# In framework/analytics.py (updated function)

def calculate_historical_volatility(
    price_data: pd.Series,
    window: int = 21,
    trading_periods: int = 252,
    method: str = 'ewma' # 'sma' or 'ewma'
) -> pd.Series:
    """
    Calculates the annualized historical volatility over a rolling window.

    Args:
        price_data (pd.Series): A pandas Series of closing prices, indexed by date.
        window (int): The rolling window period (for sma) or span (for ewma).
        trading_periods (int): The number of trading periods in a year.
        method (str): 'sma' for simple moving average or 'ewma' for exponentially
                      weighted moving average.

    Returns:
        pd.Series: A pandas Series of annualized historical volatility.
    """
    if not isinstance(price_data, pd.Series):
        raise TypeError("price_data must be a pandas Series.")

    log_returns = np.log(price_data / price_data.shift(1))

    if method == 'sma':
        rolling_std = log_returns.rolling(window=window, center=False).std()
    elif method == 'ewma':
        # Using ewm().std() is more responsive to recent volatility changes.
        rolling_std = log_returns.ewm(span=window, min_periods=window, center=False).std()
    else:
        raise ValueError("Method must be 'sma' or 'ewma'.")

    annualized_volatility = rolling_std * math.sqrt(trading_periods)

    return annualized_volatility.dropna()
Test your understanding!
Consider a scenario where a stock has been trading with very low volatility for months. Suddenly, due to an unexpected earnings announcement, it has a massive one-day price drop. Over the next few weeks, it returns to its normal, low-volatility behavior.
If you were using both a 30-day SMA-based volatility and a 30-day EWMA-based volatility calculation, how would you expect the two resulting volatility charts to differ in the 30-40 days following the price shock?
Show answer
-
SMA Volatility: The calculated volatility would spike on the day of the shock and remain at a high plateau for the next 30 days. On the 31st day, the shock event would fall out of the rolling window, and the calculated volatility would suddenly drop back to a low level, even though nothing happened in the market on that specific day. This is the "ghosting effect."
-
EWMA Volatility: The volatility would also spike on the day of the shock. However, because EWMA gives more weight to recent data, the volatility value would begin to gradually decrease over the following days as the shock becomes "older" and the new, low-volatility days receive more weight. The decay would be smooth rather than a sudden drop-off.
The EWMA approach generally gives a more intuitive and timely representation of the current volatility regime.
4. Beyond Close-to-Close: A Glimpse at Other Methods
The method we've implemented, based on the standard deviation of close-to-close log returns, is the most common form of HV. However, it's not the only one. It can miss significant price swings that occur during the trading day but are not reflected in the closing price.
More advanced estimators exist to capture this intraday volatility:
- Parkinson: Uses the day's high and low prices.
- Garman-Klass: Extends Parkinson by also incorporating the open and close prices.
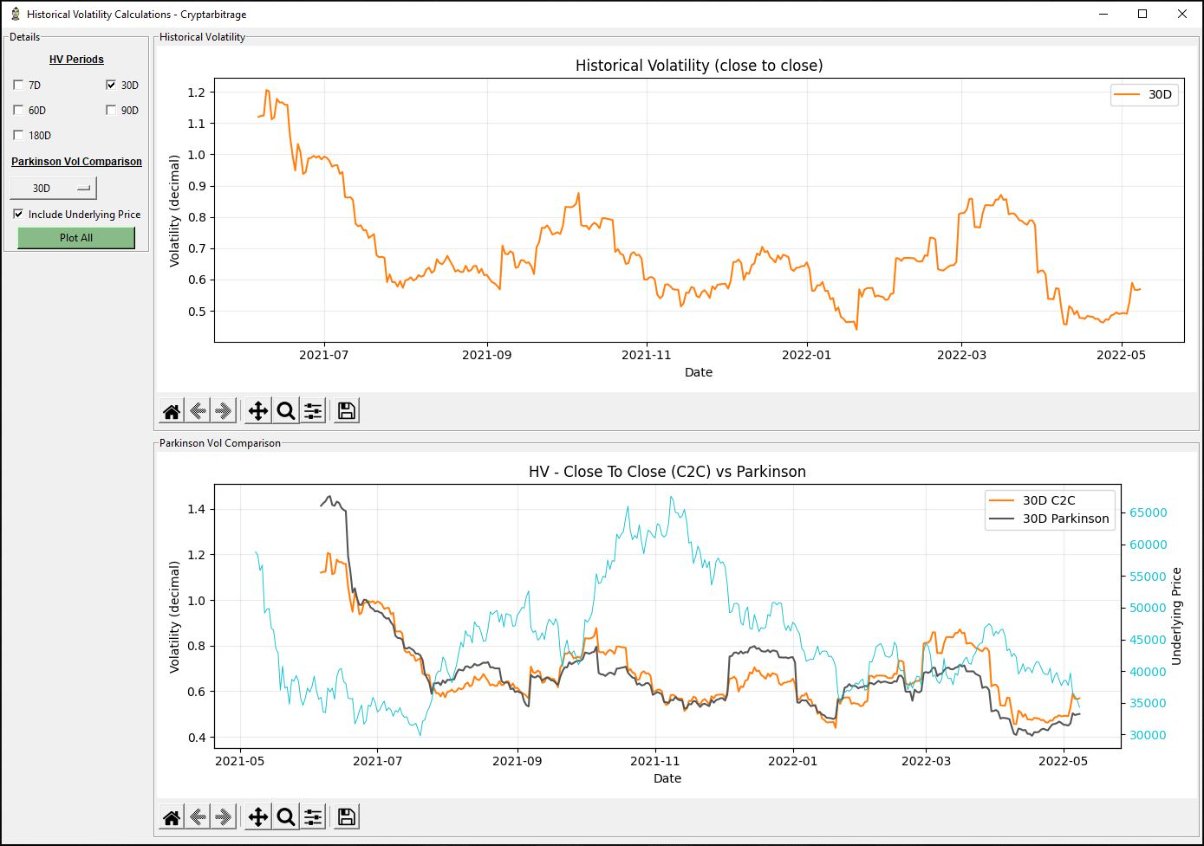
While exploring these is beyond our immediate scope, it's valuable to know they exist. For building our first signal generator, the EWMA of close-to-close returns is a robust and excellent starting point.
Conclusion
You have now built a practical and robust function to calculate historical volatility, a fundamental metric in quantitative trading. This function is a tangible asset for your trading framework.
Key Takeaways:
- Historical Volatility is the annualized standard deviation of returns, typically log returns.
- The calculation involves three steps: compute returns, find the rolling standard deviation, and annualize by multiplying by
sqrt(252). - Using an Exponentially Weighted Moving Average (
.ewm()) is often superior to a Simple Moving Average (.rolling()) as it is more responsive to recent data and avoids the "ghosting effect." - Subtle details, like using the sample standard deviation (
ddof=1), are important for numerical accuracy.
Preview of the Next Lesson:
With our calculate_historical_volatility function ready, we have one of the two key inputs for our volatility-based signal. In the next lesson, we will put this to use by implementing a concrete signal generator that compares this historical volatility to implied volatility, producing the 'ENTRY' or 'NO_ENTRY' signals our framework needs.