Hello! Welcome back to our course on building a foolproof trading system.
In the last lesson, we built a robust function to calculate historical volatility (HV), giving us a solid, backward-looking measure of an asset's price fluctuations. This was the first of two critical inputs for our first signal generator.
Today, we will complete that signal generator. Our learning outcome is to implement a concrete signal generator based on a comparison between implied and historical volatility. We will define implied volatility (IV), understand why its relationship with HV is a powerful trading concept, and then build a VolatilitySignalGenerator class that produces 'ENTRY' or 'NO_ENTRY' signals for our credit spread strategies.
1. Understanding Implied Volatility (IV)
While historical volatility looks at the past, implied volatility is a forward-looking metric. It's not calculated from past prices; instead, it is implied by the current market price of an option.
In essence, IV is the market's consensus on the future volatility of the underlying asset until the option's expiration.
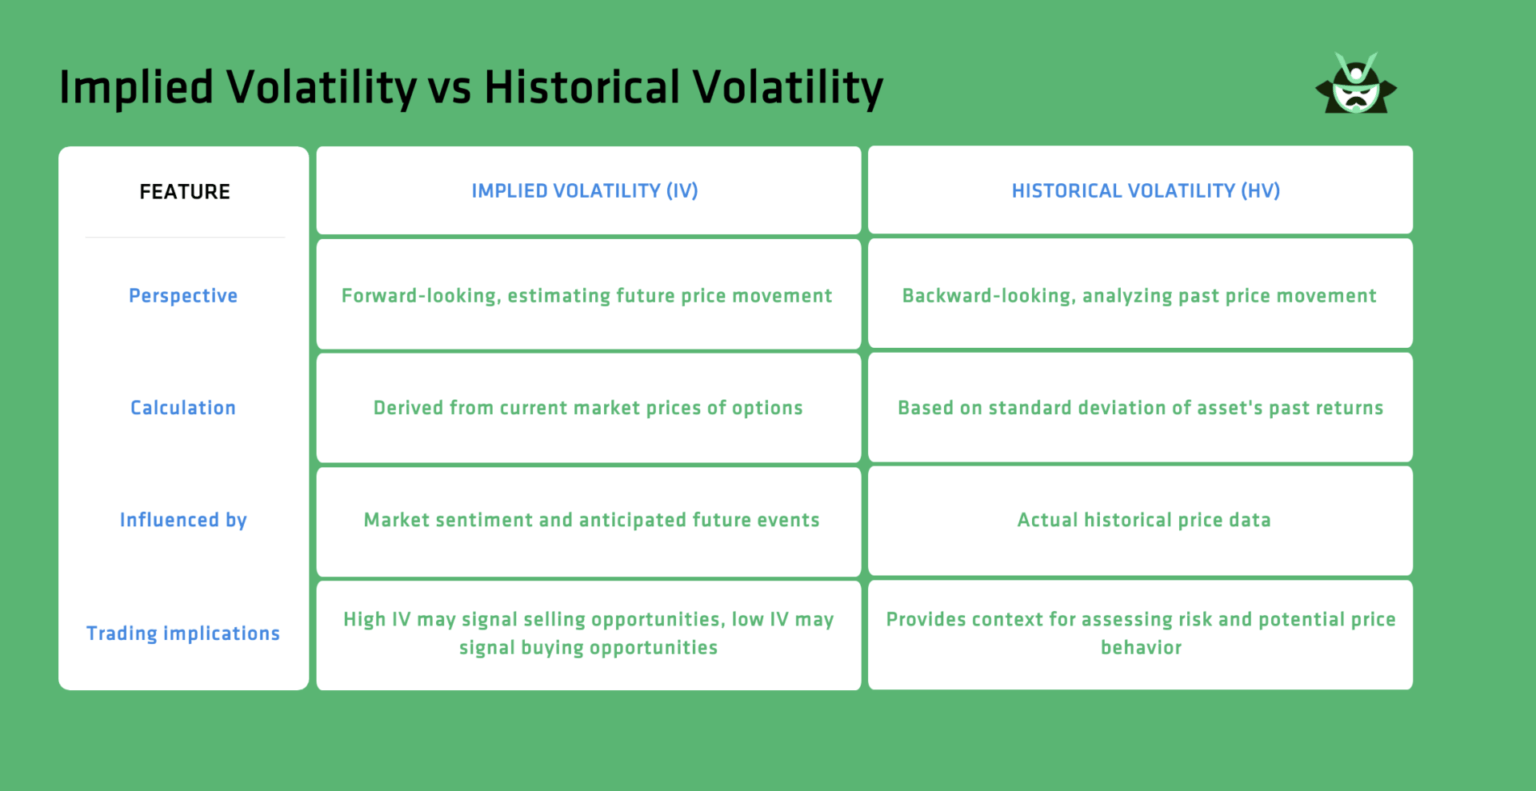
To understand this concept more deeply, let's explore how IV is determined.
Historical vs Implied Volatility with 10yrs Options Data
The video 'Historical vs Implied Volatility' from the QuantPy channel gives a clear explanation of how IV is derived from option pricing models like the Black-Scholes model.
Watch from 02:37 to 04:50. The presenter explains that to find IV, you take the current market price of an option and work backward using a pricing model to find the volatility value that makes the model's price equal the market's price.
As the video explains, pricing models like Black-Scholes take several inputs (stock price, strike price, time to expiration, interest rate, and volatility) to output a theoretical option price. To find IV, we do the reverse: we input the actual option price we see in the market and solve for the volatility.
This process, called inversion, requires a numerical root-finding method (like the Newton-Raphson method, given your math background). Fortunately, for our purposes, we don't need to implement this ourselves. Modern data providers and broker APIs provide the calculated IV value directly.
2. The IV vs. HV Relationship: The Source of the Signal
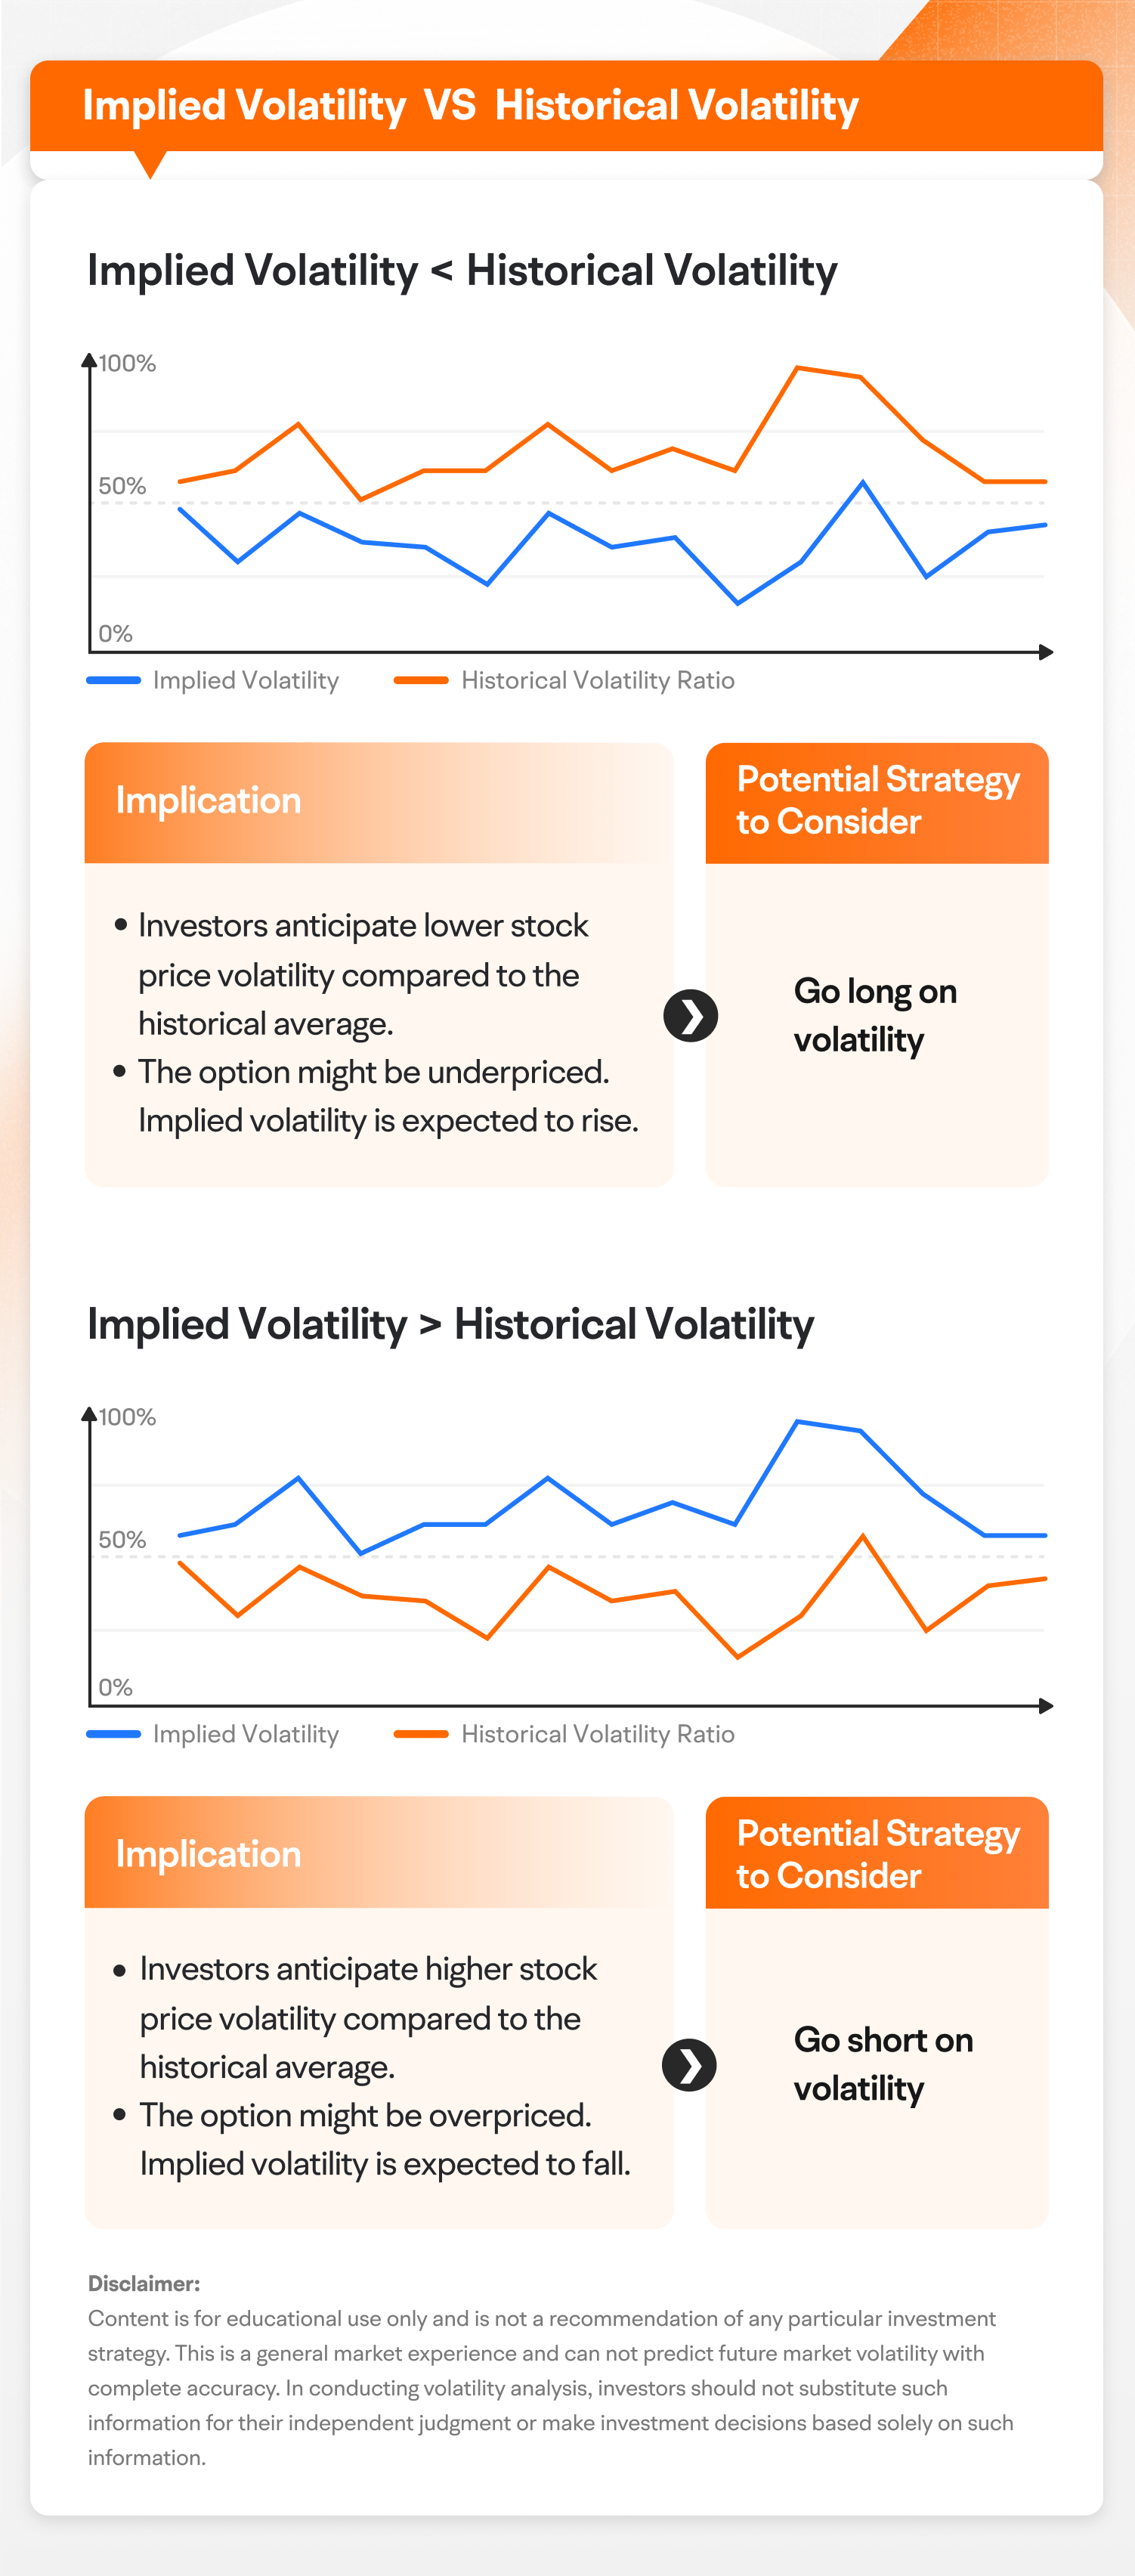
The core of our signal is the relationship between implied and historical volatility. A common theory in volatility trading is that IV and HV are mean-reverting; they tend to move together over time, but short-term dislocations create trading opportunities.
- When IV > HV: The market is pricing in more future volatility than what has been recently realized. Options are considered "expensive." This is often a good environment to sell premium, as in a credit spread strategy. You are betting that the realized volatility will be lower than the implied volatility you sold.
- When IV < HV: The market is pricing in less future volatility than what has been realized. Options are "cheap." This might be a good time to buy options.
The following image illustrates this concept perfectly.
Let's see this relationship with real data.
Historical vs Implied Volatility with 10yrs Options Data
Returning to the QuantPy video, we can now see a plot that visualizes the relationship between the historical volatility we learned to calculate last lesson and the implied volatility we've just discussed.
Watch the segment from 24:24 to 28:00. Pay close attention to the chart plotting the stock price (blue), realized volatility (red), and implied volatility (green). Notice how strongly correlated the two volatility measures are, and how one often leads or lags the other.
The strong correlation is clear. Our goal is to programmatically identify when the green line (IV) is significantly above the red line (HV) to generate a signal.
3. Implementing the VolatilitySignalGenerator
Now, let's translate this theory into code. We will create a new class, VolatilitySignalGenerator, that inherits from the SignalGenerator abstract base class we defined two lessons ago.
This class will:
- Fetch historical price data for an underlying asset.
- Use our
calculate_historical_volatilityfunction from the previous lesson to get the most recent HV value. - Fetch the current options chain.
- Extract the IV from a relevant option contract (e.g., a near-term, at-the-money contract).
- Compare HV and IV against a defined threshold.
- Return
'ENTRY'if conditions are met, otherwise'NO_ENTRY'.
For development purposes, we will use the yfinance library, which you should already have installed. It allows us to easily fetch both historical stock prices and options chain data, which includes implied volatility.
The following resource provides an excellent, practical code snippet that performs these exact steps. We will adapt it to fit into our framework's class structure.
Python Volatility Signal Generator
The article 'Python Volatility Signal Generator' contains a perfect example script for our needs. It demonstrates fetching data, calculating HV, retrieving IV, and generating a signal.
Please review the code under 'Example 1: Calculating IV/HV for a Single Stock and Outputting a Signal'. Focus on understanding the sequence: fetch history, calculate HV, get options, find an at-the-money (ATM) contract, and extract its 'impliedVolatility'. This is the exact logic we will implement.
The Code
Based on that example and our framework design, let's create our concrete class. Create a new file, framework/signal_generators.py, and add the following code.
# In framework/signal_generators.py

import yfinance as yf
import numpy as np

from framework.interfaces import SignalGenerator
from framework.analytics import calculate_historical_volatility

class VolatilitySignalGenerator(SignalGenerator):
    """
    A signal generator that compares implied volatility (IV) with
    historical volatility (HV) to generate trading signals.

    An 'ENTRY' signal is generated if IV is greater than HV by a
    specified threshold, suggesting that volatility is overpriced and
    it's a good time to sell premium (e.g., via credit spreads).
    """
    def __init__(self, ticker: str, hv_window: int = 21, iv_threshold: float = 1.2):
        """
        Initializes the VolatilitySignalGenerator.

        Args:
            ticker (str): The underlying asset's ticker symbol.
            hv_window (int): The rolling window for HV calculation (in days).
            iv_threshold (float): The multiplicative factor for comparison.
                                  e.g., 1.2 means IV must be 20% > HV.
        """
        self.ticker = ticker
        self.hv_window = hv_window
        self.iv_threshold = iv_threshold

    def generate_signals(self, event=None) -> str:
        """
        Generates a signal based on the IV vs HV comparison.

        Returns:
            str: 'ENTRY' or 'NO_ENTRY'.
        """
        try:
            stock = yf.Ticker(self.ticker)

            # 1. Calculate Historical Volatility (HV)
            # Fetch enough data for the rolling window calculation
            hist = stock.history(period=f"{self.hv_window + 5}d")
            if hist.empty:
                print(f"Warning: No historical data for {self.ticker}")
                return 'NO_ENTRY'

            # Use our function from the previous lesson
            hv_series = calculate_historical_volatility(hist['Close'], window=self.hv_window)
            latest_hv = hv_series.iloc[-1]

            # 2. Get Implied Volatility (IV) from an ATM option
            options_dates = stock.options
            if not options_dates:
                print(f"Warning: No options data for {self.ticker}")
                return 'NO_ENTRY'

            # Use the nearest expiration date
            exp_date = options_dates[0]
            opts = stock.option_chain(exp_date)

            # We can use either calls or puts; calls are common.
            # Let's use puts since our first strategy will be a Bull Put Spread.
            puts = opts.puts
            if puts.empty:
                print(f"Warning: No puts found for {self.ticker} on {exp_date}")
                return 'NO_ENTRY'

            # Find the at-the-money (ATM) put
            current_price = hist['Close'][-1]
            atm_put = puts.iloc[(puts['strike'] - current_price).abs().argsort()[:1]]

            if atm_put.empty:
                print(f"Warning: Could not find ATM put for {self.ticker}")
                return 'NO_ENTRY'

            latest_iv = atm_put['impliedVolatility'].iloc[0]

            # 3. Compare and Generate Signal
            print(f"Signal Check for {self.ticker}: HV={latest_hv:.2%}, IV={latest_iv:.2%}, Threshold={self.iv_threshold}")

            if latest_iv > latest_hv * self.iv_threshold:
                return 'ENTRY'
            else:
                return 'NO_ENTRY'

        except Exception as e:
            print(f"Error in VolatilitySignalGenerator for {self.ticker}: {e}")
            return 'NO_ENTRY'

# Example Usage (you can run this file directly to test)
if __name__ == '__main__':
    # You can change the ticker to test different stocks
    spy_signal_gen = VolatilitySignalGenerator('SPY', hv_window=21, iv_threshold=1.1)
    signal = spy_signal_gen.generate_signals()
    print(f"Final Signal for SPY: {signal}")
Why At-the-Money (ATM) Options?
We specifically choose an ATM option to source our IV because these options are typically the most liquid (highest trading volume and open interest). Their prices are considered the most reliable, and therefore the IV derived from them is a good proxy for the overall market sentiment on volatility for that expiration date.
Test your understanding!
You are configuring the VolatilitySignalGenerator for a very volatile tech stock known for large price swings. You want to be more selective and only sell credit spreads when implied volatility is exceptionally high compared to its already high historical volatility.
How would you adjust the iv_threshold parameter when initializing the generator, and why?
Show answer
You would increase the iv_threshold to a higher value, for example, from 1.2 to 1.5 or even 1.75.
A higher threshold means that implied volatility must be significantly greater than historical volatility (e.g., 50% or 75% higher) to trigger an 'ENTRY' signal. This makes the condition for entry stricter, filtering out minor discrepancies and ensuring you only act on occasions where volatility is perceived to be exceptionally overpriced, which aligns with the goal of being more selective.
Conclusion
Congratulations! You have successfully implemented a complete, concrete signal generator. This class encapsulates a classic quantitative trading strategy: volatility arbitrage. It leverages the function we built in the last lesson and connects it with live market data to produce an actionable signal.
Key Takeaways:
- Implied Volatility (IV) is a forward-looking measure of expected volatility, derived from an option's market price.
- Historical Volatility (HV) is a backward-looking measure of realized volatility, calculated from past price changes.
- The relationship between IV and HV is a powerful source for trading signals. A common strategy for selling premium is to enter trades when IV is significantly higher than HV.
- We can implement this logic in a concrete
SignalGeneratorclass, using libraries likeyfinanceto access the necessary options data.
Preview of the Next Lesson:
Our VolatilitySignalGenerator can now produce 'ENTRY' or 'NO_ENTRY' signals. However, it's currently a standalone component. In our next lesson, we will integrate the signal generator to produce 'entry' or 'no_entry' signals for the strategy classes. This will be the final step in connecting our signal generation logic to our strategy execution logic, allowing a signal to trigger the process of building and entering a credit spread trade.