Welcome to our third lesson. In our last session, we implemented a custom arena allocator, a key component for managing memory efficiently in high-performance applications. Having control over memory allocation is a powerful technique, but with great power comes great responsibility. Flawless performance is meaningless if the underlying code is plagued by memory bugs.
This lesson focuses on ensuring the correctness and robustness of our C code. We will dive into Valgrind, an indispensable tool suite for dynamic memory analysis that is standard in any serious systems programming toolkit. You will learn to use Valgrind to hunt down some of the most insidious bugs in C programming: memory leaks, invalid memory accesses, and data races. Mastering this tool is a non-negotiable skill for building the kind of "hardcore," reliable systems you're interested in.
By the end of this lesson, you will be able to confidently use Valgrind's Memcheck and Helgrind tools to validate your code, ensuring it is free from common and dangerous memory-related errors.
Why Dynamic Analysis with Valgrind?
The C compiler is excellent at catching syntax errors and performing static analysis, but many of the most dangerous bugs only manifest at runtime. These include:
- Memory Leaks: Forgetting to
freememory that you havemalloc'd. In a long-running server, even a small leak can eventually exhaust all available memory and cause a crash. - Invalid Memory Access: Reading or writing to memory you don't own. This can be due to buffer overflows, using pointers after they've been freed (
use-after-free), or using uninitialized pointers. These bugs can lead to unpredictable behavior, data corruption, and critical security vulnerabilities. - Data Races: In multi-threaded programs, unsynchronized access to shared memory by multiple threads can lead to non-deterministic and incorrect results.
Valgrind addresses these by running your compiled executable inside a virtual machine. It monitors every single memory access, checking its validity in real-time. This dynamic analysis approach is incredibly powerful for catching bugs that would otherwise be difficult to reproduce and debug.
Memcheck: Your Memory Error Detective
Memcheck is the default and most widely used tool in the Valgrind suite. Let's use it to analyze the code we wrote in the previous lesson. First, a quick primer on how it works.
This guide from Stanford's CS107 course provides an excellent introduction to Valgrind.
Start by reading the first two sections, Memory Errors Vs. Memory Leaks and Running A Program Under Valgrind. This will clarify the distinction between critical memory errors and memory leaks, and show you the basic command to run Valgrind.
Validating Our Arena Allocator
Let's start by confirming that our project from the last lesson is memory-safe. Navigate to your build directory, make sure the project is compiled, and run the application under Valgrind.
cd hnsw_from_scratch/build
cmake ..
make
valgrind ./src/hnsw_app
If everything from the last lesson was implemented correctly, Valgrind will run your program and then print a summary that looks something like this:
==12345== HEAP SUMMARY:
==12345==     in use at exit: 0 bytes in 0 blocks
==12345==   total heap usage: 1 allocs, 1 frees, 1,048,576 bytes allocated
==12345==
==12345== All heap blocks were freed -- no leaks are possible.
==12345==
==12345== ERROR SUMMARY: 0 errors from 0 contexts (suppressed: 0 from 0)
This is a clean bill of health. Notice the total heap usage: one alloc and one free for 1MB of memory. This corresponds to the malloc and free of our arena's backing buffer in main.c. The message "All heap blocks were freed" confirms our program is not leaking memory. This is the result you should always strive for.
Hunting for Memory Leaks
Now, let's intentionally introduce a leak to see how Valgrind catches it.
- Open
src/main.c. - Find the line
free(arena_buffer);at the end of themainfunction. - Comment out or delete this line.
- Recompile and run Valgrind again.
# In your build directory
make
valgrind ./src/hnsw_app
The output will now be very different.

You'll see a LEAK SUMMARY section indicating that 1,048,576 bytes in 1 blocks are definitely lost. Valgrind knows we allocated a block of memory and never freed it. The summary is helpful, but it doesn't tell us where the leak originated. To find out, we need to add the --leak-check=full flag.
valgrind --leak-check=full ./src/hnsw_app
Now, the report will include a full stack trace for each leak, pinpointing the exact line of code where the leaked memory was allocated. It will point directly to the malloc(arena_size) call in your main.c. This makes fixing leaks trivial.
To better understand the different types of leaks Valgrind reports and how to interpret the detailed output, watch the following video segment.
Fix your memory leaks with valgrind
This video provides a practical demonstration of using Valgrind to find leaks.
Watch from the beginning until the end of the leak types explanation. Pay close attention to the use of the --leak-check=full flag and the explanation of "definitely lost," "indirectly lost," and "still reachable" leaks.
Before moving on, be sure to restore the free(arena_buffer); line in main.c and verify you get a clean Valgrind report again.
Catching Invalid Memory Access
Memory leaks are problematic, but memory errors are downright dangerous. Let's look at how Valgrind detects an invalid write. We'll use a small, separate example to demonstrate this clearly.
Create a new file named bug.c with the following code. This is a classic off-by-one error.
#include <stdlib.h>
#include <string.h>

int main() {
    // Allocate space for 5 chars, but "hello" requires 6 (5 letters + null terminator).
    char *s = malloc(5);
    strcpy(s, "hello"); // This will write 6 bytes into a 5-byte buffer.
    free(s);
    return 0;
}
Compile this file with the -g flag (essential for debugging symbols) and run it under Valgrind:
gcc -g -o bug bug.c
valgrind ./bug
Valgrind will immediately report an Invalid write of size 1.
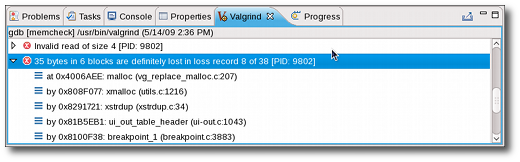
The report tells you:
- The exact location of the error (
strcpycall inbug.c). - The address being written to.
- That the address is just past the end of a block allocated by
malloc.
This level of detail is invaluable. Without Valgrind, this bug might not cause an immediate crash, but could silently corrupt other data, leading to bizarre behavior much later in the program's execution.
The Stanford guide has a great section on memory errors.
Read the section Finding Memory Errors. It walks through a similar strcpy example and lists other common errors Valgrind can find, like Use of uninitialised value and Invalid free().
For a more in-depth video walkthrough of debugging various memory errors like invalid writes, use-after-free, and using uninitialized values, the following resource is excellent.
C Dynamic Memory Debugging with Valgrind
This tutorial by Brian Fraser provides clear, step-by-step examples of finding and fixing common C memory bugs with Valgrind.
Watch the section on invalid writes and leaks. This covers a bug very similar to our bug.c example. Next, watch the demonstration of a use-after-free error. Finally, see how Valgrind catches the use of uninitialized values, particularly when returning a pointer to a stack variable.
Helgrind: Finding Data Races in Concurrent Code
Your learning outcome includes identifying data races. While our project is single-threaded for now, we will be adding concurrency in Module 8. It's crucial to know that Valgrind provides tools for this. Helgrind is a Valgrind tool specifically designed to detect synchronization errors in multi-threaded programs.
A data race occurs when:
- Two or more threads access the same memory location concurrently.
- At least one of the accesses is a write.
- The threads use no explicit synchronization (like a mutex) to protect the access.
Data races are a source of maddening, non-deterministic bugs. Let's look at a canonical example.
Valgrind Part 6 – Helgrind and DRD - ACCU
This article introduces Valgrind's thread-safety tools, Helgrind and DRD.
First, read the introduction to understand why thread debugging is hard and what Helgrind is for. Then, study the example in the section on data races. You don't need to type and run the code yourself, but focus on understanding the C++ code in Listings 2, 3, and 4. The code creates two threads that both modify a single global variable (forget_me_not) without any locks. This is a classic data race.
To run Helgrind, you use the --tool=helgrind flag. If you were to run the code from the article, the command would be:
valgrind --tool=helgrind ./your_threaded_program
Helgrind's output, as shown in Figure 4 of the article, would explicitly state "Possible data race" and provide stack traces for the two conflicting accesses (a read from one thread and a write from another). This allows you to precisely locate where you need to add synchronization primitives like mutexes.
We will not go deeper into Helgrind today, but keep it in your toolkit. When we begin parallelizing our graph construction in Module 8, Helgrind will be an essential partner in ensuring our concurrent code is correct.
Conclusion
In this lesson, you've added a critical tool to your low-level programming arsenal. You now understand how to use Valgrind to build more reliable and robust C applications.
Key takeaways:
- Valgrind is a dynamic analysis tool that detects memory errors at runtime.
- Always compile with
-gto give Valgrind the debug symbols it needs to provide useful line number information. - Memcheck is the default tool for finding memory leaks and memory access errors like buffer overflows, use-after-free, and use of uninitialized values.
- Use
--leak-check=fullto get detailed stack traces for memory leaks. - Helgrind (
--tool=helgrind) is a specialized tool for detecting data races and other synchronization problems in multi-threaded code. - Aim for a "Valgrind-clean" program: zero errors and zero leaks.
We have now spent a great deal of time on the foundations of a robust C project: a solid build system with CMake, an efficient custom memory allocator, and a powerful debugging tool with Valgrind. We've focused on making our code correct. In the next lesson, we will shift our focus to making it fast. We'll introduce the Linux perf tool to profile our application, identify CPU bottlenecks, and understand its interaction with the hardware cache.