Following our last session where we secured our project's memory correctness with Valgrind, we now shift our focus from making the code correct to making it fast. This lesson introduces you to the Linux perf tool, the quintessential profiler for any developer serious about high-performance systems programming. In fields like high-frequency trading, where nanoseconds matter, understanding exactly how your code interacts with the CPU is not just an advantage—it's a requirement.
Today, you will learn to use perf to dissect your application's runtime behavior. We will cover how to profile CPU usage to find "hot" code paths, and then dig deeper to analyze hardware-level events like cache misses and branch mispredictions. Mastering perf provides the data-driven foundation needed to make intelligent optimization decisions, moving beyond guesswork and intuition.
What is perf?
While Valgrind runs your code in a virtual machine to check for correctness, perf takes a different approach. It's a powerful sampling-based profiler built into the Linux kernel that hooks into the CPU's own Performance Monitoring Unit (PMU). These are special hardware counters that can track events like instructions executed, CPU cycles, cache misses, and more, with very low overhead. This direct hardware access is what makes perf an indispensable tool for low-level performance analysis.
To begin, let's get a high-level overview of what perf is and the kinds of questions it can answer from Brendan Gregg, a leading expert in systems performance.
Read the introductory section, starting from the beginning, to understand the scope and power of perf_events.
The Profiling Workflow
A typical performance investigation with perf follows a clear, iterative process. You start with a broad overview, narrow down on hotspots, and then zoom in to the instruction level to understand the root cause.

Before we start, it's critical to ensure our program is compiled correctly for profiling. perf needs debug information to map performance events back to your source code.
- Open your project's
CMakeLists.txt. - Find the line
set(CMAKE_C_FLAGS "${CMAKE_C_FLAGS} -Wall -Wextra"). - Modify it to include the
-gflag for debug symbols and-fno-omit-frame-pointerto ensureperfcan reliably reconstruct call stacks. The latter prevents a common compiler optimization that can break profilers.
Your flags should now look like this:set(CMAKE_C_FLAGS "${CMAKE_C_FLAGS} -Wall -Wextra -g -fno-omit-frame-pointer")
After saving the file, clean your build directory and recompile to apply the new flags:
cd hnsw_from_scratch/build
rm -rf ./*
cmake ..
make
Step 1: A High-Level View with perf stat
The first step in any profiling session is to get a high-level summary of your application's performance. The perf stat command is perfect for this. It runs a program and provides aggregate counts for a default set of important hardware events.
This command gives you immediate insight into your program's characteristics:
- Instructions Per Cycle (IPC): A key indicator of CPU efficiency. An IPC greater than 1 suggests the CPU is successfully executing multiple instructions per cycle (superscalar execution). A low IPC (less than 1) indicates the CPU is spending a lot of time stalled, waiting for data from memory or other resources.
- Cache Misses: A high cache miss rate means the CPU is frequently having to fetch data from slower main memory instead of the fast on-chip caches. This is a common and significant performance bottleneck.
- Branch Misses: Modern CPUs use branch prediction to guess which way a conditional jump will go, pre-emptively fetching instructions along that path. A misprediction forces the CPU to discard that work and fetch from the correct path, causing a pipeline flush and a performance penalty.
To have something to profile, let's add a simple, computationally-intensive function to our src/main.c.
#include <stdio.h>
#include <stdlib.h>
#include "arena.h"

// Add this new function at the top of main.c
// A function designed to be CPU-bound for profiling purposes.
double cpu_intensive_task(int iterations) {
    double result = 0.0;
    for (int i = 0; i < iterations; ++i) {
        for (int j = 1; j < 1000; ++j) {
            result += 1.0 / (double)j;
        }
    }
    return result;
}

int main() {
    size_t arena_size = 1024 * 1024; // 1 MB
    void* arena_buffer = malloc(arena_size);
    if (!arena_buffer) {
        perror("Failed to allocate memory for arena");
        return 1;
    }

    Arena arena;
    arena_init(&arena, arena_buffer, arena_size);

    // Call our new function here
    printf("Running a CPU-intensive task for profiling...\n");
    double r = cpu_intensive_task(50000);
    printf("Task finished. Result (to prevent optimization): %f\n", r);

    // ... rest of your main function, if any ...

    free(arena_buffer);
    printf("Arena buffer freed.\n");

    return 0;
}
Now, recompile and run the application under perf stat:
# from your build directory
make
perf stat ./src/hnsw_app
You will see output similar to this:
 Performance counter stats for './src/hnsw_app':

      2,608.82 msec task-clock                #    0.999 CPUs utilized
             3      context-switches          #    0.001 K/sec
             0      cpu-migrations            #    0.000 K/sec
           135      page-faults               #    0.052 K/sec
10,344,888,103      cycles                    #    3.966 GHz
19,655,773,283      instructions              #    1.90  insn per cycle
 3,952,154,640      branches                  # 1514.921 M/sec
     1,179,321      branch-misses             #    0.03% of all branches

       2.610996      seconds time elapsed
In this example, the IPC is 1.90, which is quite good. The branch miss rate is very low (0.03%), which is also excellent. This gives us a baseline understanding before we dig deeper.
For a clearer demonstration of perf stat, the following video is quite useful.
Bytes of Architecture: Performance Profiling Basics
This video by Nick shows a very clear, practical use of perf stat.
Watch the segment from this timestamp where perf stat -D is used to get a high-level statistical summary of a benchmark's execution.
Step 2: Finding Hotspots with perf record & perf report
perf stat tells us if we have a problem (like low IPC), but not where in the code the problem is. To find the "hotspots"—the functions where our program spends most of its time—we use perf record and perf report.
perf record: Runs the program and collects performance data by periodically sampling the state of the CPU. By default, it samples thecyclesevent.perf report: Analyzes theperf.datafile generated byperf recordand presents an interactive, browsable report showing which functions were most frequently sampled.
Let's profile our application. The -g flag is crucial as it tells perf to capture call-graph (stack trace) information.
# from your build directory
perf record -g ./src/hnsw_app
This will generate a perf.data file. Now, analyze it:
perf report
This opens a Text-based User Interface (TUI). You'll see a list of functions, sorted by the percentage of CPU time spent in them. The top entry should be our cpu_intensive_task. You can navigate with the arrow keys. Notice the columns:
- Overhead: The percentage of total samples that occurred in this symbol (function).
- Command: The executable name.
- Shared Object: The library or executable the symbol belongs to.
- Symbol: The function name.
Bytes of Architecture: Performance Profiling Basics
The same video provides an excellent demonstration of the record and report cycle.
Watch from this section to see how perf record captures data and perf report is used to navigate the results and identify the program's main hotspot.
Step 3: Zooming in with perf annotate
Once you've identified a hot function in perf report, you can drill down even further to see which specific lines of code are responsible. perf annotate disassembles the function and shows the percentage of samples that fell on each assembly instruction.
In the perf report TUI, navigate to cpu_intensive_task and press a. You will see a view that interleaves the C source code with the corresponding assembly, with percentages next to the "hot" instructions.
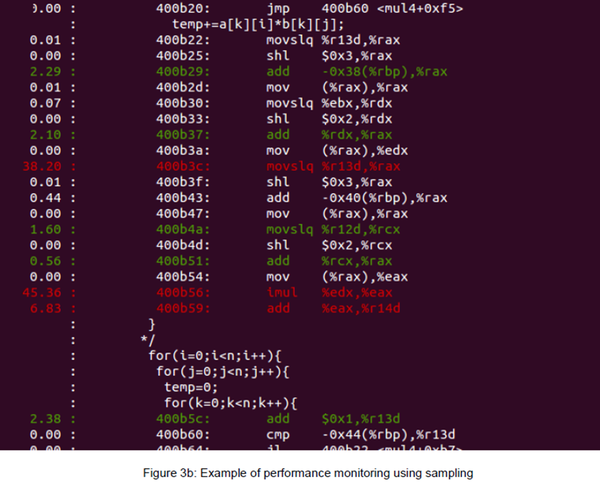
You should see that the highest overhead is concentrated on the floating-point division and addition instructions inside the innermost loop, which is exactly what we'd expect. This level of detail is invaluable when you need to understand the performance of tight loops, which are common in scientific computing and high-performance applications.
How to profile your C code using gprof and linux perf
This video provides another perspective on the record/report/annotate workflow.
Watch the part of the video covering perf, from here. The presenter uses perf to find a bottleneck in a simple C program and then uses the annotate feature to inspect the assembly code, highlighting exactly where the time is being spent in a loop.
Going Deeper: Profiling Hardware Events
So far, we've profiled based on CPU time (by sampling the cycles event). But the real power of perf for low-level optimization comes from its ability to sample based on other hardware events. This allows you to answer questions like: "Which parts of my code are causing the most cache misses?" or "Where are branch mispredictions happening?"
Brendan Gregg's guide explains how to profile based on specific hardware events.
First, read the section Event Profiling to understand the concept of sampling on hardware counters like cache misses instead of time. Pay attention to the concept of sampling thresholds (-c). Next, review the section CPU Statistics to see how to use perf stat with specific counters, which is how you directly measure cache and branch performance.
Let's put this into practice. To find out which functions are causing the most L1 data cache misses, you could run:
# Sample every 10,000 L1 d-cache misses and record a stack trace
perf record -e L1-dcache-load-misses -c 10000 -g ./src/hnsw_app
perf report
Similarly, to find code causing branch mispredictions:
# Sample every 1,000 branch misses
perf record -e branch-misses -c 1000 -g ./src/hnsw_app
perf report
Running these commands on your cpu_intensive_task will likely yield few samples, because the code is very simple and cache/branch-friendly. However, when working with complex data structures and algorithms—as we will be later in this course—this technique is critical for identifying and fixing data layout and access pattern inefficiencies.
Conclusion
In this lesson, you've learned the fundamentals of performance profiling with Linux perf, a cornerstone tool for any systems engineer. We have moved from verifying correctness with Valgrind to quantifying performance with perf.
Key takeaways:
- The standard
perfworkflow isrecord->report->annotate. perf statgives a high-level summary of hardware events like IPC, cache misses, and branch mispredictions, helping you form a hypothesis about performance.perf record -gsamples your application to find CPU "hotspots"—the functions where the most time is spent.perf annotatezooms into a specific function to show which machine instructions are the most expensive.- You can sample on specific hardware events (e.g.,
cache-misses) to directly attribute them to parts of your code.
Now that you have the tools to measure performance and identify bottlenecks, our next step is to learn the techniques to eliminate them. In the next module, we will begin our deep dive into high-performance vector math. We will start by implementing naive distance functions and then, using the profiling skills you've just acquired, we will systematically optimize them using SIMD (Single Instruction, Multiple Data) intrinsics to achieve massive performance gains.