Hello! In our last couple of lessons, we explored the concept of the indefinite integral, which answers the question, "Given a function's derivative, what is the original function?". We learned how to find these antiderivatives using a table of basic formulae.
Today, we shift our focus to a seemingly unrelated problem, but one that lies at the very heart of calculus: how do we find the area of an irregular shape bounded by a curve? This lesson will introduce a powerful method for approximating this area.
Your learning outcome for this lesson is to be able to approximate the area under a curve using Riemann sums. This technique forms the conceptual foundation for the definite integral, which we will tackle in our next lesson.
1. The Area Problem
Imagine you have a function, say , and you want to find the exact area of the region under its graph, bounded by the x-axis and two vertical lines at and .
If the function were a simple horizontal line (forming a rectangle) or a straight diagonal line (forming a trapezium/trapezoid), you could use basic geometry. But what if the top boundary is a curve?
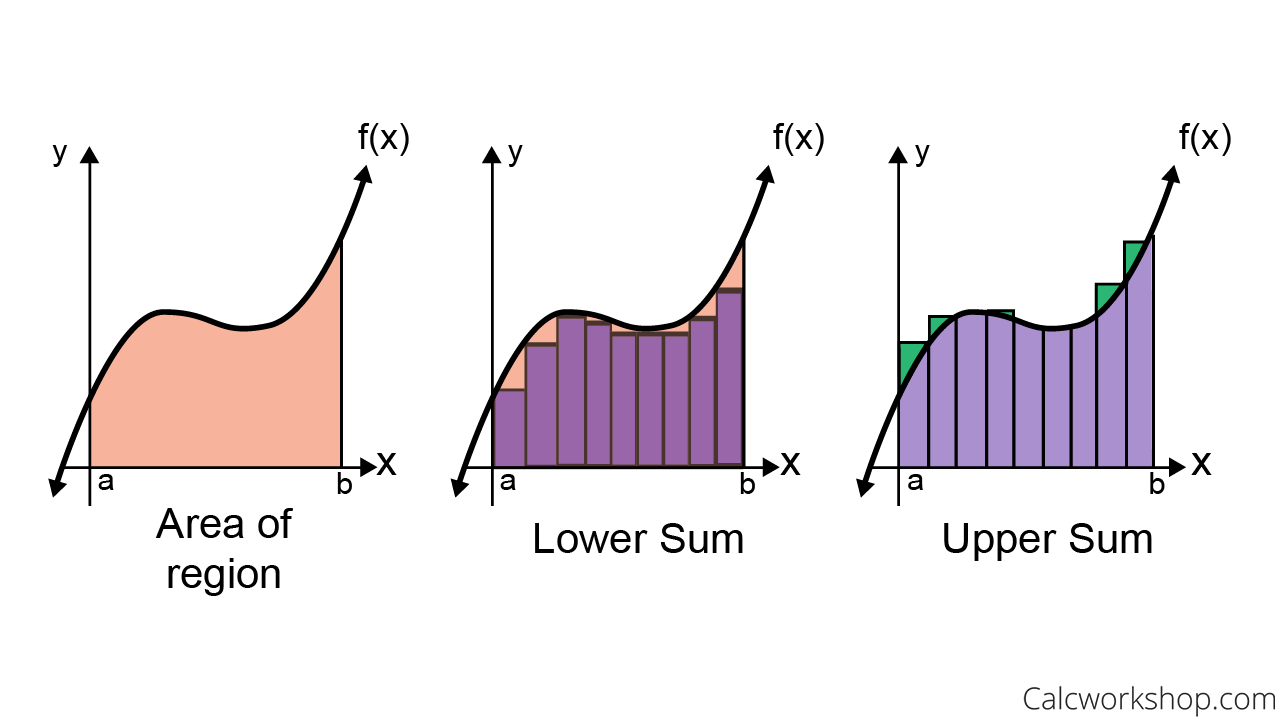
The fundamental idea, as shown in the image above, is to approximate this irregular area by filling it with a shape we do know how to measure: the rectangle. By summing the areas of several rectangles, we can get a good estimate of the total area. This sum is called a Riemann Sum, named after the 19th-century German mathematician Bernhard Riemann.
2. Building the Approximation
To create our rectangular approximation, we follow a systematic process:
-
Partition the Interval: We take the interval on the x-axis from to and divide it into smaller subintervals of equal width. The width of each of these subintervals is denoted by .
Here, is the number of rectangles we choose to use.
-
Determine the Heights: For each subinterval, we draw a rectangle whose base is . The crucial question is: how tall should each rectangle be? The height is determined by the value of the function at a specific point within that subinterval. There are three common conventions for choosing this point.
3. Left, Right, and Midpoint Riemann Sums
The three most common methods for determining the height of the rectangles are the Left-hand Rule, the Right-hand Rule, and the Midpoint Rule.

Let's define each one. We'll label the endpoints of our subintervals as , where and .
-
Left Riemann Sum (): The height of each rectangle is determined by the function's value at the left endpoint of the subinterval.
The total area is: -
Right Riemann Sum (): The height of each rectangle is determined by the function's value at the right endpoint of the subinterval.
The total area is: -
Midpoint Riemann Sum (): The height of each rectangle is determined by the function's value at the midpoint of the subinterval. If we call the midpoint of the -th interval , the area is:
where .
4. A Worked Example
Seeing these rules in action makes them much clearer. The following video provides an excellent, step-by-step demonstration of how to calculate the Left, Right, and Midpoint Riemann sums for a specific function.
Riemann Sums Example: Finding Left, Right, and Midpoint Riemann Sums
This video from Math with Dr. Claire will walk you through calculating each type of Riemann sum for the function f(x) = x³ + 1 on the interval [-1, 5].
Please watch from 01:18 to 10:54. The video is broken down into three clear parts: Left Riemann Sum (from 01:18): Pay attention to how the endpoints (x₀, x₁, x₂) are chosen. Right Riemann Sum (from 05:04): Note which endpoints are used this time. Midpoint Riemann Sum (from 07:48): See how the midpoints are calculated first before being used to find the rectangle heights.
After watching the video, let's try a problem.
Test your understanding!
Approximate the area under the curve of on the interval using a Right Riemann Sum with rectangles.
- First, what is the width of each rectangle, ?
- What are the right endpoints of the four subintervals?
- Calculate the height of each rectangle using the right endpoints.
- Sum the areas of the four rectangles to find the approximation .
Show answer
-
The interval is from to , with rectangles.
Each rectangle has a width of 1. -
The subintervals are . The right endpoints are .
-
The heights are the function values at these right endpoints:
-
The total area approximation is the sum of (height × width):
So, the Right Riemann Sum approximation of the area is 34 square units.
5. The Formal Definition of a Riemann Sum
So far, we have only considered partitions with equal subinterval widths and specific choices for the height (left, right, or midpoint). The formal definition of a Riemann Sum is more general.
To get a formal handle on this, the following resource from The Open University provides a clear, concise definition.
1.2 Integration on the real line
This reading from the Open University, 'Integration on the real line', formalises the concepts we've just discussed.
Please read the text and study the figures from the beginning of Section 1.2 down to (and including) Example 1. Focus on the formal definitions of a 'partition' and a 'Riemann sum'. Notice that their example uses the right-hand endpoint, just as we did in our exercise.
In its most general form, a Riemann sum doesn't require the subintervals to be of equal width. Furthermore, the point chosen within each subinterval to determine the rectangle's height can be any point in that subinterval, not just an endpoint or midpoint.
A general Riemann Sum is therefore:
where is the width of the -th subinterval and is any sample point within it. For our purposes in this course, we will almost always use subintervals of equal width (), as it simplifies the calculations significantly.
6. Improving the Approximation
It seems logical that using more, narrower rectangles would give a better approximation of the area. As we increase , the number of rectangles, our sum gets closer to the true area under the curve. The error in our approximation—the small regions that are either over- or under-counted—gets smaller and smaller.
This leads to a profound idea: what if we could use an infinite number of rectangles? If we take the limit of the Riemann sum as the number of rectangles approaches infinity (and thus the width of each rectangle approaches zero), we should get the exact area.
Conclusion
In this lesson, we have built the machinery to approximate the area under a curve.
Key Takeaways:
- The area under a curve can be approximated by summing the areas of multiple rectangles, a method known as a Riemann sum.
- The interval is divided into subintervals, each forming the base of a rectangle with width .
- The height of each rectangle can be determined using different rules, most commonly the Left-hand Rule, Right-hand Rule, or Midpoint Rule.
- Increasing the number of rectangles () generally leads to a more accurate approximation of the area.
This concept of approximating area is the crucial stepping stone to our next topic. We will see how the limit of a Riemann sum as gives us the exact area and leads to the formal definition of the definite integral.