Hello! Welcome to the sixth module of our course. In the previous modules, we've explored algebraic functions like polynomials and rational functions, where the variable x appears in the base of a power, such as in or . Now, we're shifting our focus to a new and powerful family of functions where the variable appears in the index (exponent), like in .
Today's lesson kicks off our study of exponential and logarithmic functions. Our learning outcome is to evaluate exponential functions and analyse (analyze) their graphs and properties. These functions are fundamental in mathematics and are used to model a vast range of real-world phenomena, from population growth and compound interest to radioactive decay and the cooling of objects.
1. What is an Exponential Function?
An exponential function is a function of the form:
where:
ais a constant called the base.xis the variable, which is in the index (or exponent).
This structure is the reverse of what we've seen in polynomials. Before we explore their behaviour, we need to establish some important rules about the base a.
Graphs of Exponential Functions (Precalculus - College Algebra 52)
To understand why we have these rules, let's watch a segment from the video 'Graphs of Exponential Functions' by Professor Leonard. He explains what an exponential function is and why the base 'a' must be positive and not equal to 1.
Watch from 00:46 to 02:49. Pay attention to his reasoning for excluding negative bases, a base of 0, and a base of 1.
To summarise the key constraints on the base a:
amust be positive (a > 0). If the base were negative, the function would oscillate between positive and negative values (e.g., , ), resulting in a disconnected graph that is not useful for modelling continuous growth or decay.acannot be 1. Ifa=1, the function becomes , which is just a constant horizontal line.
Therefore, for exponential functions, we only consider bases where a > 0 and a ≠ 1. This leaves us with two main categories to investigate: a > 1 and 0 < a < 1.
Evaluating these functions relies heavily on the rules of indices (powers) you learned back in Module 2. As a quick refresher:
- (Any non-zero base to the power of 0 is 1)
- (A negative index indicates a reciprocal)
- (A fractional index indicates a root)
2. Graphing and Analysing Exponential Functions
The best way to understand the properties of exponential functions is to see them visually. We'll build the graphs by plotting points calculated from their equations.
Exponential Functions - Introduction : ExamSolutions
The video 'Exponential Functions - Introduction' from ExamSolutions, a UK-based resource, provides a clear, step-by-step guide to sketching these graphs. We'll start with the case where the base 'a' is greater than 1.
Watch from the beginning to 05:49. The presenter will first define an exponential function and then construct tables of values to sketch the graphs of y = 2^x and y = 3^x. Notice how both graphs share a common point and how their steepness compares.
Case 1: Exponential Growth (a > 1)
As you saw in the video, when the base a is greater than 1, the function value increases as x increases. This is called exponential growth.
Let's look at the graph of .
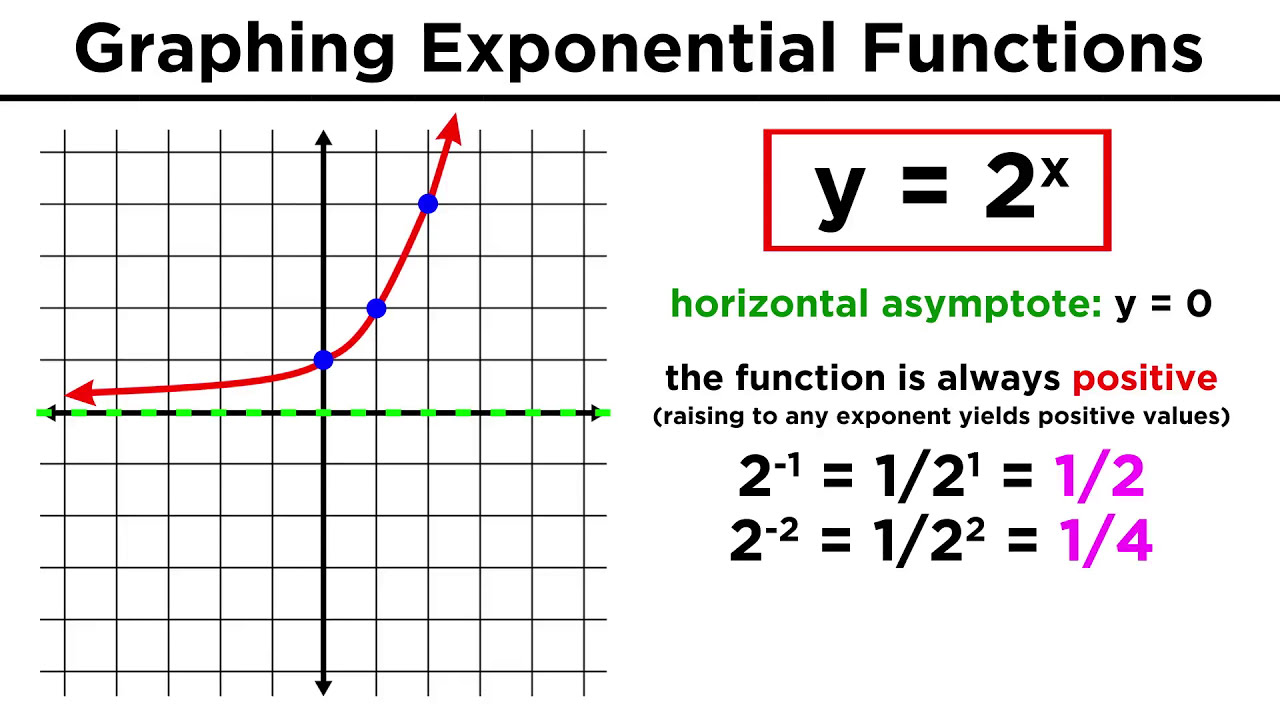
Based on the video and this graph, let's identify the key properties for functions like and , where a > 1:
- Domain: You can put any real number
xinto the function, so the domain is . - Range: The output
yis always positive. The graph never touches or crosses the x-axis. The range is . - Y-intercept: The graph always crosses the y-axis at the point (0, 1), because for any base
a. - Horizontal Asymptote: The graph gets closer and closer to the x-axis () as
xbecomes more negative (). The line is a horizontal asymptote. - Behaviour (Behavior): The function is always increasing. As
xincreases,yincreases. - Key Point: The graph always passes through the point (1, a), because . For , this is the point (1, 2). For , it's (1, 3).
When comparing and , notice that for , the graph of is steeper. For , the graph of is closer to the x-axis.
Case 2: Exponential Decay (0 < a < 1)
What happens when the base is a fraction between 0 and 1?
Exponential Functions - Introduction : ExamSolutions
Let's continue with the same ExamSolutions video to explore the graph of y = (1/2)^x.
Watch from 07:31 to 10:02. The presenter sketches the graph of y = (1/2)^x. Pay close attention to the relationship he points out between this graph and the graph of y = 2^x.
This is called exponential decay. When 0 < a < 1, the function value decreases as x increases.
A crucial insight here is the connection to negative indices. Remember that can be written as , which simplifies to . This means the graph of is a reflection of the graph of in the y-axis.
The properties are very similar to the growth case:
- Domain:
- Range:
- Y-intercept: Still at (0, 1).
- Horizontal Asymptote: The x-axis (), but this time the graph approaches it as
xbecomes more positive (). - Behaviour (Behavior): The function is always decreasing. As
xincreases,ydecreases. - Key Point: The graph still passes through (1, a). For , this is the point (1, 1/2).
Test your understanding!
Consider the function and .
- What is the y-intercept for each function?
- Is an increasing or decreasing function?
- Is an increasing or decreasing function?
- What is the relationship between their graphs?
Show answer
- The y-intercept for both functions is (0, 1), since and .
- Since the base is 5 (which is > 1), is an increasing function.
- Since the base is 1/5 (which is between 0 and 1), is a decreasing function.
- The graph of is a reflection of the graph of in the y-axis.
This image provides a great summary of the general characteristics for all exponential functions of the form .

3. The Natural Exponential Function: e^x
In your scientific and IT work, you will frequently encounter one special base: the number e. This is an irrational number, like , and it's also known as Euler's number.
Its value is approximately:
The function is called the natural exponential function. It's arguably the most important exponential function because it arises naturally in many areas of calculus, finance, and science.
Graphs of Exponential Functions (Precalculus - College Algebra 52)
Let's return to Professor Leonard's video to get an introduction to this special number and its function.
Watch from 17:28 to 20:57. He introduces the number 'e' and explains how the graph of y = e^x fits into the family of exponential functions we've already discussed.
Since , the base is greater than 1. This means the function has all the properties of an exponential growth function:
- It is an increasing function.
- It passes through the key points (0, 1) and (1, e).
- It has a horizontal asymptote at .
- Its graph lies between the graphs of and .
You can calculate values of on most scientific calculators, usually using a button labelled e^x.
Conclusion
In this lesson, we have introduced the family of exponential functions, . We established that their behaviour is determined by the value of the base a.
Key Takeaways:
- An exponential function has the form , where
ais a positive constant not equal to 1. - If
a > 1, the function represents exponential growth. It is always increasing. - If
0 < a < 1, the function represents exponential decay. It is always decreasing. The graph of is a reflection of in the y-axis. - All exponential functions share these common properties:
- Domain: All real numbers.
- Range: All positive real numbers ().
- They pass through the point (0, 1).
- They have a horizontal asymptote at the x-axis ().
- The function , where , is the natural exponential function and is a case of exponential growth.
Preview of the Next Lesson:
Now that we have a solid understanding of exponential functions, a natural question arises: if we know the output y, can we find the input x that produced it? This involves finding the inverse of the exponential function. In our next lesson, we will define the logarithm as the inverse of an exponential function and learn how to move between exponential and logarithmic forms.