Welcome back! In our last lesson, we mastered the essential skill of loading data from CSV and Excel files into Pandas. As we discussed, real-world data is rarely as clean as we'd like. You've already seen a first line of defense against messy data: the na_values parameter in pd.read_csv(), which tells Pandas to recognize certain strings as missing upon import.
This lesson dives deep into the next critical step of data cleaning. We will explore various strategies to handle missing data that is already present in your DataFrame. Deciding how to deal with these gaps—represented in Pandas as NaN (Not a Number)—is a fundamental skill that prevents errors, reduces bias, and ensures the reliability of your analysis and machine learning models.
1. Understanding and Identifying Missing Data
Before we fix the problem, it's crucial to understand why it happens and how to find it. Missing data isn't just a nuisance; it can tell a story. For instance, why might a user not report their income in a survey? The reason could influence how you decide to handle that missing value.
This article provides a great conceptual overview of missing data.
Missing Value Imputation, Explained: A Visual Guide with Code ...
This article from Towards Data Science introduces the "why" behind missing data.
Please read the first three sections: "What Are Missing Values and Why Do They Occur?": This will give you context on the sources of missing data. "Types of Missing Data": Focus on understanding the difference between MCAR, MAR, and MNAR at a high level. This aligns with your preference for an "intuition-first" approach and helps in making more informed decisions later. "Why Care About Missing Values?": This summarizes the impact on your analyses.
Now that you have the conceptual background, let's look at a map of the techniques we'll explore. This flowchart provides an excellent overview of the different paths you can take when confronted with missing values.
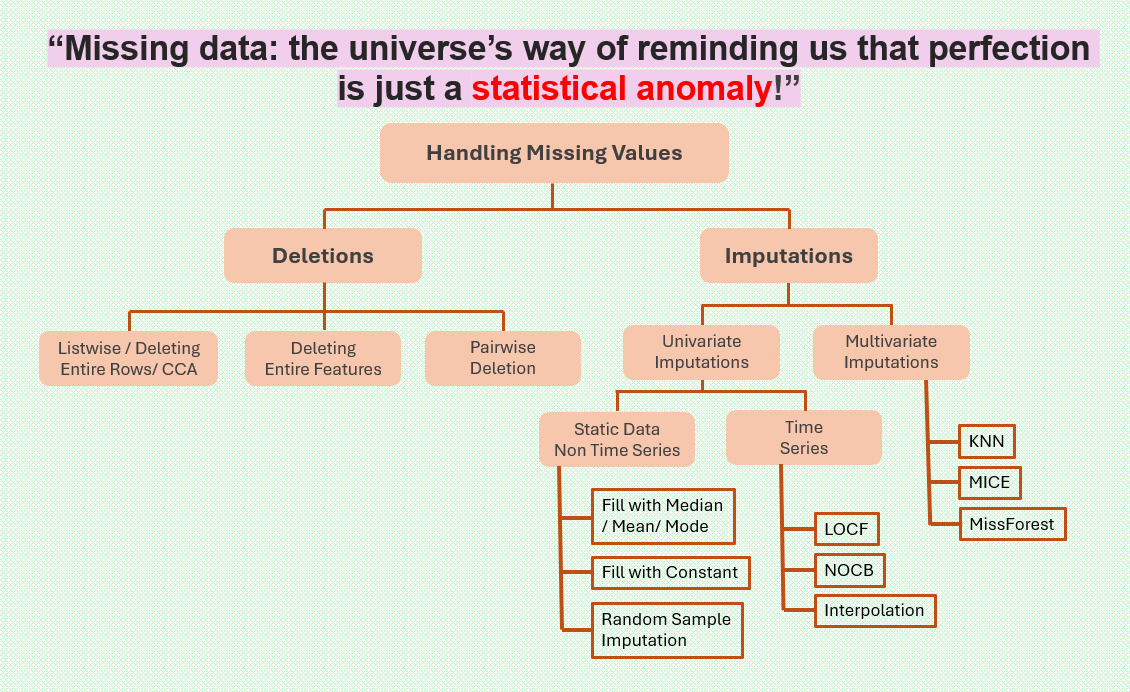
The first practical step is to identify where the missing values are in your DataFrame. Pandas makes this easy with the .isnull() method (an alias for .isna()), which returns a boolean DataFrame. We typically chain this with .sum() to get a count of missing values per column.
import pandas as pd
import numpy as np


# Sample DataFrame with various missing values
data = {
    'product': ['A', 'B', 'C', 'D', 'E'],
    'price': [100, 120, np.nan, 150, 110],
    'category': ['Elec', 'Elec', 'Home', np.nan, 'Home'],
    'sales_last_month': [50, np.nan, 20, 35, np.nan]
}
df = pd.DataFrame(data)

print("Original DataFrame:")
print(df)
print("\n" + "="*30 + "\n")


# Check for missing values
print("Boolean mask of missing values:")
print(df.isnull())
print("\n" + "="*30 + "\n")


# Get a count of missing values per column
print("Count of missing values per column:")
print(df.isnull().sum())
2. Deletion Strategies: The dropna() Method
The most straightforward approach is to simply remove rows or columns that contain missing data. This is known as listwise deletion when dropping rows.
- Pros: It's simple and fast. If the amount of missing data is very small, it might not significantly harm your dataset.
- Cons: You lose data. If the missing values are not randomly distributed, you could introduce bias into your analysis.
The dropna() method is your tool for this. The following video gives a fantastic, detailed walkthrough of its most important parameters.
Python Pandas Tutorial (Part 9): Cleaning Data - Casting Datatypes and Handling Missing Values
This video by Corey Schafer, "Cleaning Data - Casting Datatypes and Handling Missing Values," provides a clear and practical guide. We'll focus on the dropna() portion first.
Watch this segment on removing missing data: Using dropna(): Pay close attention to the key arguments: axis: 0 or 'index' to drop rows (default), 1 or 'columns' to drop columns. how: 'any' to drop if at least one NA is present (default), 'all' to drop only if all values are NA. subset: This is extremely useful. It allows you to specify a list of columns to consider when looking for NA values. For example, you might only drop rows that are missing a value in a critical column like user_id.
3. Imputation Strategies: Filling in the Gaps
Instead of deleting data, we can often make an educated guess to fill in, or impute, the missing values. This preserves your sample size but requires careful thought. The video below covers the most common imputation functions in Pandas.
Python Pandas Tutorial 5: Handle Missing Data: fillna, dropna, interpolate
This video from the codebasics channel, "Handle Missing Data: fillna, dropna, interpolate," offers excellent, concise examples of various filling techniques.
Please watch these sections, which demonstrate different imputation strategies: Filling with fillna(): This covers filling with a static value (like 0), using a dictionary to fill different columns with different values, and the very useful forward-fill (ffill) and backward-fill (bfill) methods. Advanced fillna() parameters: Learn how to use the axis parameter to fill horizontally and the limit parameter to control how many consecutive NaNs are filled. Interpolation: This covers the interpolate() method, a more intelligent way to fill ordered numerical data. Notice the powerful difference between the default linear interpolation and method='time', which is invaluable for time-series data.
To complement the video, let's summarize the main imputation techniques.
a) Filling with a Constant, Mean, or Median
- Constant: Use
df.fillna(0)ordf.fillna('Unknown'). This is simple but can distort the column's statistical properties. - Mean/Median: A more robust approach for numerical data is to fill with the column's mean or median. The median is often preferred as it's less sensitive to outliers.
Data Cleaning and Handling Missing Data
This article from "The Examples Book" gives a clear example of filling with a statistical measure.
Focus on the section "Mean or Median". It provides a code snippet for filling missing values with the median of a column, a very common and effective technique.
Here is how you would apply it:
# Create a sample DataFrame
df_numeric = pd.DataFrame({'scores': [88, 92, np.nan, 75, 95, 85, np.nan]})


# Fill with the mean
mean_imputed = df_numeric['scores'].fillna(df_numeric['scores'].mean())
print("Mean Imputed:\n", mean_imputed)


# Fill with the median (more robust to outliers)
median_imputed = df_numeric['scores'].fillna(df_numeric['scores'].median())
print("\nMedian Imputed:\n", median_imputed)
b) Forward and Backward Fill (ffill, bfill)
As you saw in the codebasics video, these methods are excellent for ordered data (like time series), where you can assume a missing value is the same as the one immediately before or after it.
c) Interpolation
The interpolate() method is a step up from ffill/bfill for numerical, ordered data. It fills NaN values by treating them as points on a line between the known values. This often provides a more realistic estimate than simply carrying a previous value forward.
4. Case Study: Cleaning Real-World Survey Data
Now, let's apply these concepts to a realistic scenario. In the previous lesson, you learned to handle custom missing values like "not available" during import using na_values. What happens when your data contains strings that aren't technically missing, but prevent numerical analysis?
The following segment from Corey Schafer's video walks through a perfect example using Stack Overflow survey data to calculate the average years of coding experience.
Python Pandas Tutorial (Part 9): Cleaning Data - Casting Datatypes and Handling Missing Values
Let's return to Corey Schafer's video to see a practical data cleaning workflow.
This final segment is a mini case-study that ties everything together: Real-World Example: Follow along as the presenter tries to calculate the mean of the YearsCode column. The initial attempt fails because the column contains strings. unique() is used to identify the problematic string values: 'Less than 1 year' and 'More than 50 years'. replace() is used to convert these strings into numerical equivalents (0 and 51). astype(float) is used to convert the entire column to a numeric type, which now succeeds. Finally, .mean() can be successfully calculated.
This example is a powerful illustration of a typical data cleaning workflow: identify a problem, investigate its root cause, apply targeted cleaning steps, and then proceed with your analysis.
Conclusion
You now have a solid toolkit for one of the most common tasks in data science: handling missing data. There is no single "best" method; the right choice is always context-dependent.
Key Takeaways:
- Identify First: Always start by using
.isnull().sum()to understand the extent of missing data in your dataset. - Deletion (
dropna): A quick and easy solution, but use with caution. It's best when the amount of missing data is small. Thesubsetparameter gives you fine-grained control. - Imputation (Filling): A powerful way to preserve data. Your main tools are:
fillna(): For constants, statistical measures (mean/median), or propagation (method='ffill'/'bfill').interpolate(): For smarter filling of ordered numerical data.
- Context is King: The choice of strategy depends on the data type (numeric vs. categorical), the nature of the data (e.g., time series), and the potential reasons for the data being missing.
In our next lesson, we'll build directly on this. Now that you know how to load and clean your data, we'll learn how to perform summary statistics and initial data inspection using .info(), .describe(), and .value_counts(). This will allow us to quickly understand the main characteristics of our dataset before diving into more complex analysis and visualization.