Hello! In our last lesson, you learned how to use window functions like RANK, LAG, and LEAD to perform calculations across entire partitions of your data. We saw how this approach is more powerful than simple GROUP BY aggregations because it preserves individual rows.
In this lesson, we'll take that concept a step further. Instead of operating on the whole partition, you will learn to define a smaller, moving "window" or frame of rows around the current row. This is the key to calculating two of the most common metrics in data analysis: running totals and moving averages. Mastering this will allow you to analyze trends, track cumulative progress, and smooth out noisy data—all essential skills for a data scientist.
1. Calculating Running Totals
A running total (or cumulative sum) calculates the sum of a value from the start of a sequence up to the current row. It's used everywhere, from tracking cumulative sales in a quarter to monitoring the total number of user sign-ups over time.
In the last lesson, our window functions operated on the entire partition. To calculate a running total, we need to tell SQL to create a window that starts at the first row and ends at the current row. This is done using a frame clause within the OVER() clause.
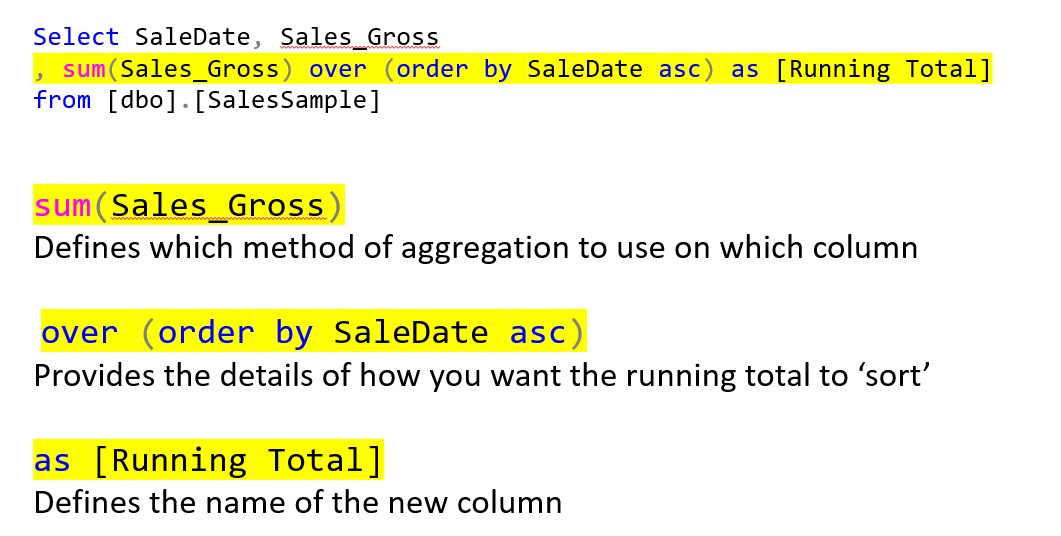
The explicit way to define this frame is with ROWS BETWEEN UNBOUNDED PRECEDING AND CURRENT ROW. Let's break that down:
ROWS: Specifies that the frame is defined by a physical number of rows.UNBOUNDED PRECEDING: The frame starts at the very first row of the partition.CURRENT ROW: The frame ends at the row currently being processed.
This article provides a clear explanation and examples.
5 Practical Examples of Using ROWS BETWEEN in SQL
This article from learnsql.com gives a great breakdown of the ROWS clause and its options.
First, read the section "ROWS Clause: Syntax and Options" to understand the different ways you can define a frame's boundaries. Then, study Example 1, which shows how ROWS BETWEEN UNBOUNDED PRECEDING AND CURRENT ROW is used to calculate a simple running total of revenue. Finally, review Example 4, which demonstrates how this concept is combined with PARTITION BY to calculate separate running totals for different social networks.
As you saw in the article, when ORDER BY is used, SQL often assumes ROWS BETWEEN UNBOUNDED PRECEDING AND CURRENT ROW as the default frame for aggregate functions like SUM(). This means that a simpler query often works for running totals:
SELECT
  SaleDate,
  SaleAmount,
  SUM(SaleAmount) OVER (ORDER BY SaleDate) AS RunningTotal
FROM Sales;
While this shortcut is convenient, explicitly writing the full ROWS BETWEEN... clause makes your query clearer and is good practice, especially as you start building more complex frames.
2. Computing Moving Averages
Running totals are great for tracking cumulative growth, but sometimes we need to understand recent trends and smooth out day-to-day volatility. This is where moving averages (also called rolling averages) come in. A moving average calculates the average of a value over a specific number of recent periods, like a 7-day or 30-day moving average.
To do this, we just need to adjust our window frame. Instead of an UNBOUNDED start, we specify a fixed number of rows to look back. For a 3-day moving average, the frame would include the current day and the two preceding days.
The syntax for this is ROWS BETWEEN 2 PRECEDING AND CURRENT ROW.
This video provides an excellent, step-by-step guide to calculating rolling values.
SQL Running Total | Advance SQL | Rolling N months SUM, AVG, MIN, MAX
This video from Ankit Bansal walks through the concept and implementation of rolling calculations in SQL.
First, watch the introduction to understand what rolling values are and how they are calculated conceptually. Next, see the implementation for a 3-month rolling sum. Pay close attention to the ROWS BETWEEN 2 PRECEDING AND CURRENT ROW syntax. Then, watch the segment on different window frames, which introduces the FOLLOWING keyword and frames that are centered around the current row (e.g., 1 PRECEDING AND 1 FOLLOWING). Finally, see how easily this can be adapted to other calculations in the average, min, and max section.
As the video demonstrated, this technique is incredibly versatile. By simply changing the aggregate function (SUM, AVG, MIN, MAX, COUNT) or the frame definition, you can answer a wide range of analytical questions.
For example, to calculate a 7-day moving average of temperature, partitioned by city, you would write:
SELECT
  city,
  date,
  temperature,
  AVG(temperature) OVER (
    PARTITION BY city
    ORDER BY date
    ROWS BETWEEN 6 PRECEDING AND CURRENT ROW
  ) AS moving_avg_7_day
FROM weather_data;
3. A Quick but Important Detail: ROWS vs. RANGE
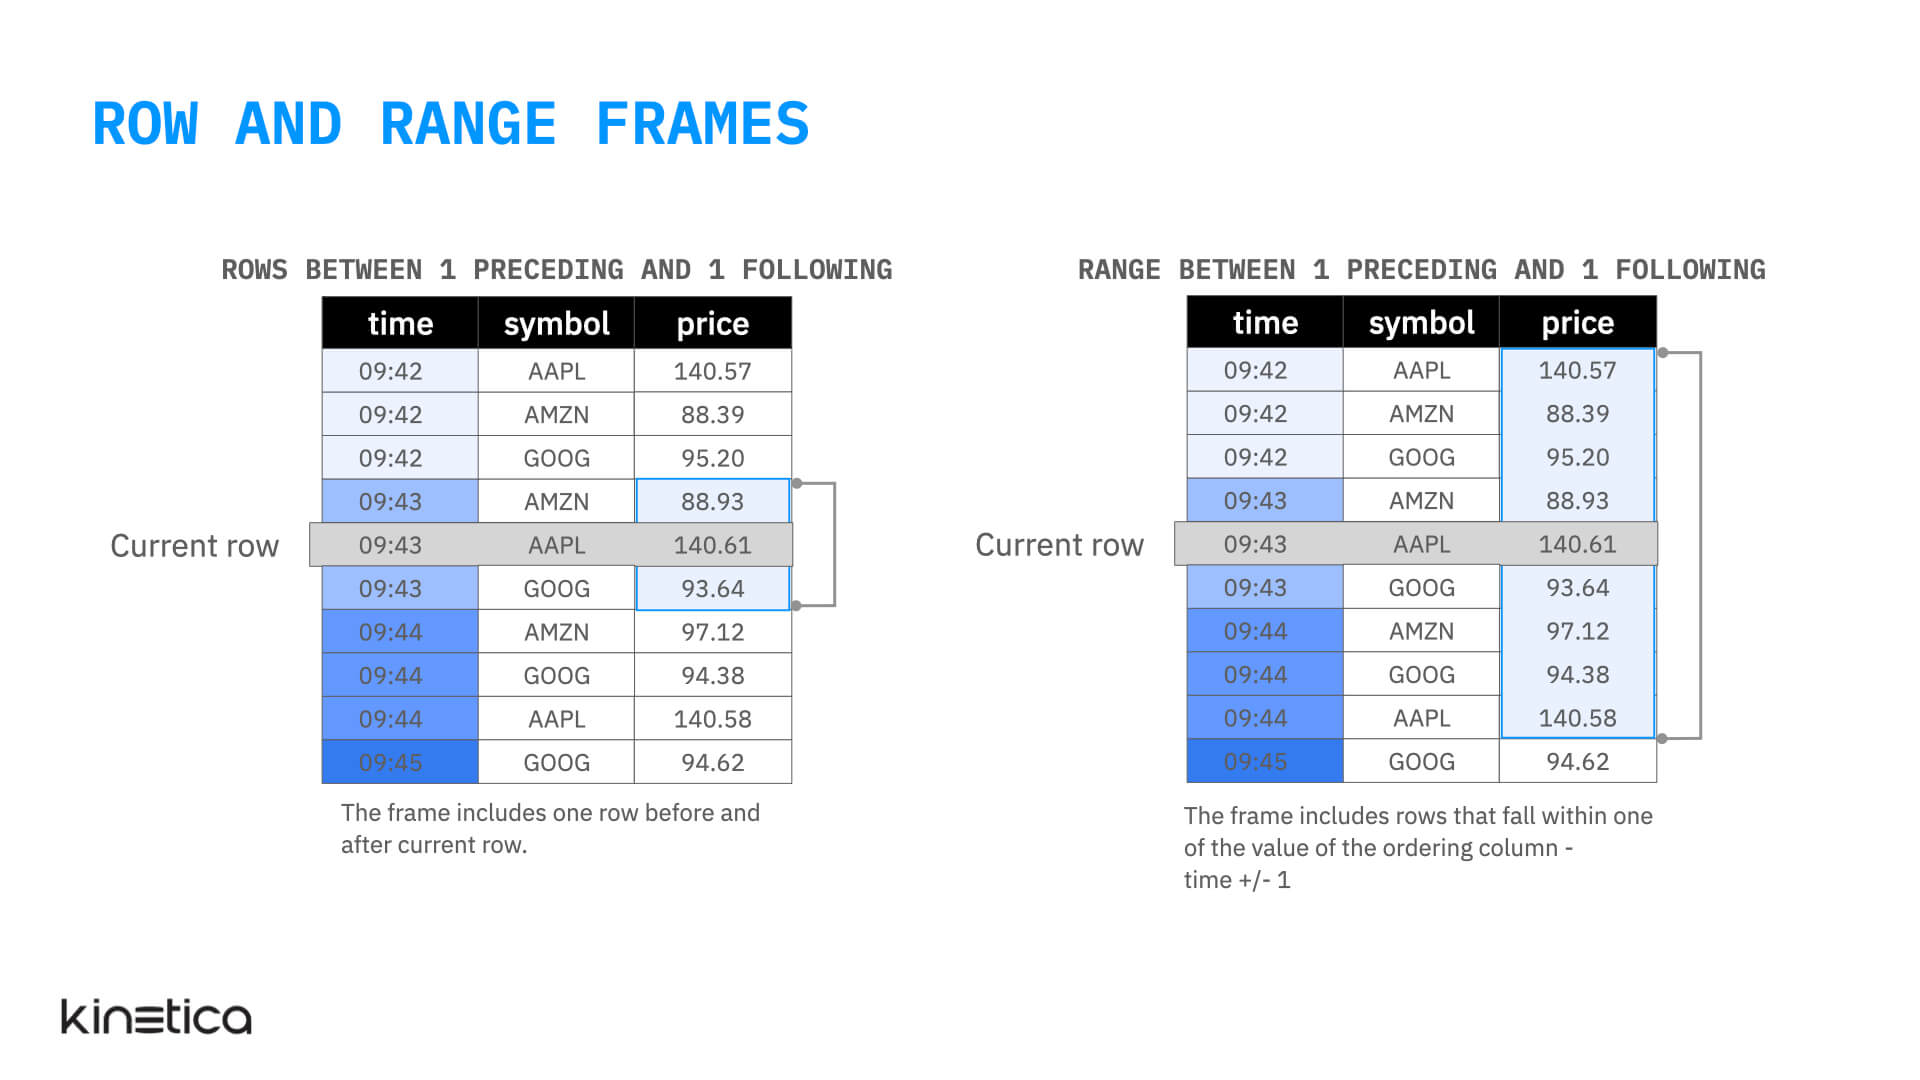
So far, we've only used ROWS to define our frame. There is another keyword, RANGE, that can also be used. While they often produce the same result, they behave differently when there are ties in the ORDER BY column.
ROWS: Defines the frame based on a fixed number of physical rows before and after the current row.ROWS BETWEEN 1 PRECEDING AND 1 FOLLOWINGalways includes exactly three rows (if available).RANGE: Defines the frame based on a logical range of values relative to the value in the current row's ordering column.RANGE BETWEEN 1 PRECEDING AND 1 FOLLOWINGon apricecolumn would include all rows where the price is within 1 unit of the current row's price. If multiple rows have the same price, they are all included.
For most running total and moving average tasks based on sequential data like dates, ROWS is what you want. RANGE is more specialized, for example, if you wanted to find the average price of all items within $10 of the current item's price.
This image provides a great visual comparison.
Understanding this distinction will help you write more precise queries and avoid unexpected results when dealing with data that contains duplicate values in your ordering column.
4. Practice Exercises
Let's apply what you've learned. Consider the following table, daily_revenue, which tracks revenue for two different online services.
| service | date | revenue |
|---|---|---|
| 'A' | '2023-10-01' | 100 |
| 'A' | '2023-10-02' | 120 |
| 'A' | '2023-10-03' | 80 |
| 'A' | '2023-10-04' | 110 |
| 'B' | '2023-10-01' | 50 |
| 'B' | '2023-10-02' | 60 |
| 'B' | '2023-10-03' | 55 |
| 'B' | '2023-10-04' | 70 |
Problem 1: Calculate the cumulative revenue for each service
Task: For each service, calculate the running total of revenue, ordered by date.
Desired Output:
| service | date | revenue | cumulative_revenue |
|---|---|---|---|
| 'A' | '2023-10-01' | 100 | 100 |
| 'A' | '2023-10-02' | 120 | 220 |
| 'A' | '2023-10-03' | 80 | 300 |
| 'A' | '2023-10-04' | 110 | 410 |
| 'B' | '2023-10-01' | 50 | 50 |
| 'B' | '2023-10-02' | 60 | 110 |
| 'B' | '2023-10-03' | 55 | 165 |
| 'B' | '2023-10-04' | 70 | 235 |
Solution
SELECT
  service,
  date,
  revenue,
  SUM(revenue) OVER (
    PARTITION BY service
    ORDER BY date
    ROWS BETWEEN UNBOUNDED PRECEDING AND CURRENT ROW
  ) AS cumulative_revenue
FROM daily_revenue;
Note: The simpler SUM(revenue) OVER (PARTITION BY service ORDER BY date) would also work here, but being explicit with the frame clause is clearer.
Problem 2: Calculate the 3-day moving average revenue
Task: For each service, calculate the 3-day moving average of revenue. For the first two days of each service, the average will be based on the available data (1 and 2 days, respectively).
Desired Output:
| service | date | revenue | moving_avg_3day |
|---|---|---|---|
| 'A' | '2023-10-01' | 100 | 100.00 |
| 'A' | '2023-10-02' | 120 | 110.00 |
| 'A' | '2023-10-03' | 80 | 100.00 |
| 'A' | '2023-10-04' | 110 | 103.33 |
| 'B' | '2023-10-01' | 50 | 50.00 |
| 'B' | '2023-10-02' | 60 | 55.00 |
| 'B' | '2023-10-03' | 55 | 55.00 |
| 'B' | '2023-10-04' | 70 | 61.67 |
Solution
SELECT
  service,
  date,
  revenue,
  -- We cast to numeric/decimal to ensure floating-point division
  ROUND(
    AVG(revenue) OVER (
      PARTITION BY service
      ORDER BY date
      ROWS BETWEEN 2 PRECEDING AND CURRENT ROW
    ), 2
  ) AS moving_avg_3day
FROM daily_revenue;
Conclusion
You've now added another crucial tool to your SQL analytics toolkit. By defining explicit window frames, you can move beyond static, whole-partition calculations and perform sophisticated sequential analysis.
Key Takeaways:
- A window frame defines a specific subset of rows within a partition for a window function to operate on.
- Running totals are calculated using a frame that grows with each row, typically
ROWS BETWEEN UNBOUNDED PRECEDING AND CURRENT ROW. - Moving averages are calculated using a sliding frame of a fixed size, like
ROWS BETWEEN 6 PRECEDING AND CURRENT ROWfor a 7-day average. - The same frame clause syntax can be used with
SUM,AVG,COUNT,MIN, andMAXto compute various rolling metrics. ROWSdefines a frame by physical row count, which is what you'll use most often for time-series analysis.
In our next lesson, we'll shift gears and explore how to use CASE statements, both on their own and within aggregate functions. This will enable you to implement conditional logic, create custom categories, and even pivot data from a "long" to a "wide" format—another powerful technique for creating summary reports.