Introduction
In our previous lesson, we explored how resource scheduling works to efficiently assign computational tasks to available resources like virtual machines. We now have our tasks running, but a critical question remains: are the resources performing well? Are they overloaded, underutilized, or on the verge of failing?
Answering these questions is the job of resource monitoring. This lesson directly follows our discussion on scheduling by focusing on how we observe and measure the performance of the resources that are executing the scheduled tasks.
Today, we will focus on the learning outcome: Define resource monitoring and list key performance metrics to track (e.g., CPU utilization, memory, network throughput). We will establish a clear, exam-ready definition for resource monitoring and then systematically identify the essential metrics that cloud administrators use to maintain system health, ensure performance, and control costs.
What is Resource Monitoring?
To begin, let's establish a formal definition that you can use in your exams.
Definition: Resource Monitoring is the systematic process of collecting, analyzing, and using data to track the performance and health of cloud resources and applications. It provides the visibility needed to detect issues, manage capacity, and ensure that resources are operating efficiently and meeting Service Level Agreements (SLAs).
The primary purpose of monitoring is to move from a reactive state (fixing things after they break) to a proactive one (preventing issues before they impact users).
For a clear overview of why monitoring is so crucial, please review the following short article.
Performance Monitoring Server Panel Tools, Metrics, and Tips
The article 'Performance Monitoring Server Panel Tools, Metrics, and Tips' provides a concise definition and outlines the key advantages and benefits of implementing a monitoring process.
Please read the first section, 'What is a Performance Monitoring Server Panel?', to solidify your understanding of the definition and its key advantages. Then, read the section '4 Benefits of Using a Performance Monitoring Software' to understand the high-level goals of monitoring.
Based on that reading, the core benefits of resource monitoring are:
- Proactive Issue Detection: Identify potential problems like resource exhaustion or failing components before they cause downtime.
- Enhanced Visibility: Gain a clear and detailed understanding of how your entire system is behaving in real-time.
- Faster Troubleshooting: When an issue does occur, monitoring data provides the necessary context to find the root cause quickly, reducing the Mean Time to Resolution (MTTR).
- Capacity Planning and Optimization: Data on resource usage helps in making informed decisions about scaling resources up or down, preventing over-provisioning (wasting money) and under-provisioning (poor performance).
To see how these concepts are applied in a major cloud platform, watch the beginning of this video on Amazon Web Services' (AWS) monitoring tool, CloudWatch.
Basics of Amazon CloudWatch and CloudWatch Metrics | AWS Tutorials for Beginners
This video from Tiny Technical Tutorials introduces AWS CloudWatch and explains the fundamental reasons why monitoring is necessary in a cloud environment.
Watch the segment from 00:13 to 01:05. Focus on the questions the video poses, such as 'what does the website traffic look like?' and 'how is performance?'. These are the exact questions that resource monitoring aims to answer.
Key Performance Metrics to Track
The learning outcome requires you to "list key performance metrics." A metric is a quantifiable measure that tracks a specific process or component. In cloud computing, metrics are typically collected as a time-ordered series of data points (e.g., CPU utilization was 45% at 10:00 AM, 48% at 10:01 AM, etc.).
This infographic provides an excellent visual summary of the most essential metrics for monitoring infrastructure.
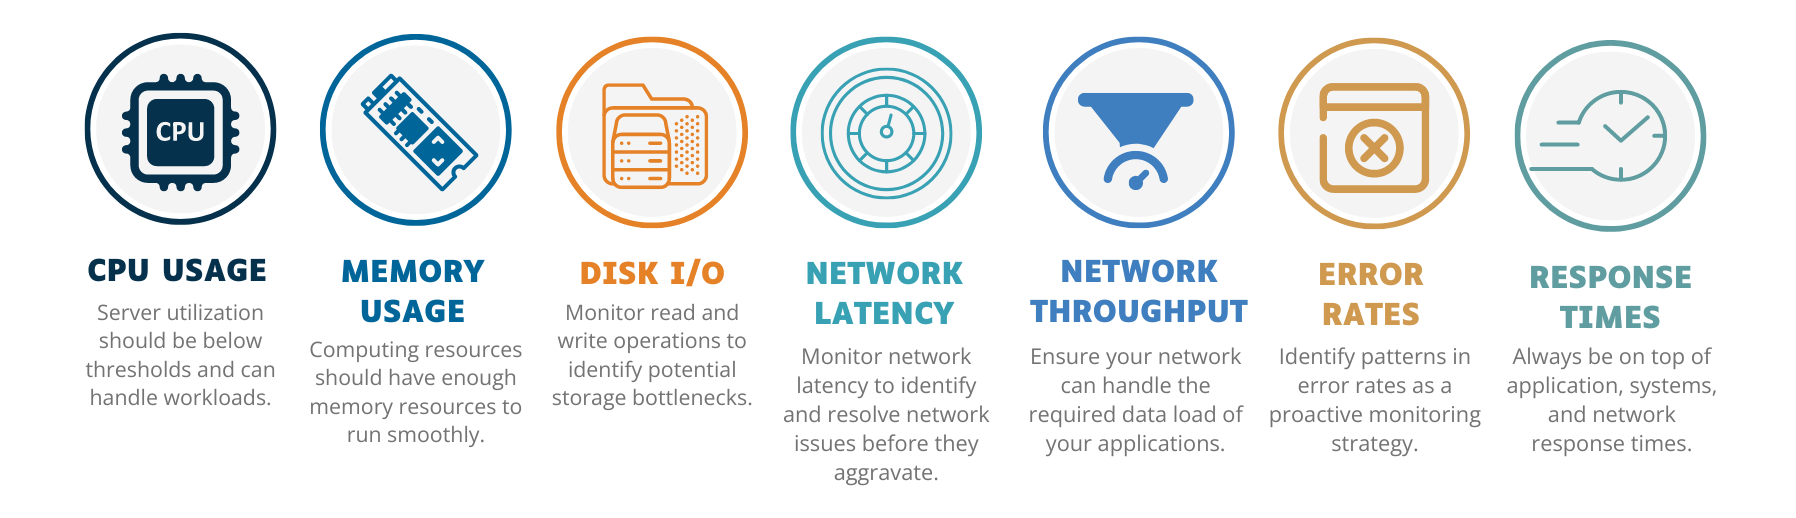
For your exam preparation, a structured table is one of the most effective ways to present this information. The following table, adapted from the "Performance Monitoring Server Panel Tools, Metrics, and Tips" article, clearly outlines the most important metrics, what they track, and why they matter.
| Metric | What It Tracks | Why It Matters |
|---|---|---|
| CPU Usage | The percentage of CPU resources being used by processes. | High usage can slow down the entire system, leading to latency and poor performance. |
| Memory Usage | The amount of RAM being consumed by applications and the OS. | Insufficient memory forces the system to use slow disk swapping, degrading performance. |
| Disk I/O | Input/Output operations per second (IOPS) and read/write speeds. | Slow disk performance can create bottlenecks for database-intensive applications. |
| Network Performance | Bandwidth utilization (throughput) and the delay in data transfer (latency). | Ensures smooth data transmission and efficient communication between services. |
| Response Time | How quickly the server responds to user or application requests. | A direct measure of user experience; lower is better. |
| Server Uptime | The percentage of time a server is operational and available. | A critical indicator of reliability and adherence to SLAs. |
| Error Rate | The percentage of requests that fail due to application or server issues. | An increase in error rate often signals a problem with a recent deployment or a failing component. |
To deepen your understanding, let's explore some of these core metrics in more detail.
Cloud Performance Monitoring Metrics for CTOs - SquareOps
The article 'Cloud Performance Monitoring Metrics for CTOs' provides excellent, detailed explanations for each key metric. We'll focus on the foundational ones: CPU, Memory, and Network.
Please read the sections titled 'Metric 1: CPU Utilization', 'Metric 2: Memory Utilization', 'Metric 4: Network Latency', and 'Metric 5: Throughput'. For each, pay close attention to the 'Why It Matters' subsection, as this provides the reasoning you'll need for exam answers.
Let's summarize the key compute, storage, and network metrics you should know:
1. Compute Metrics
- CPU Utilization: Measures the percentage of time the CPU is busy processing instructions.
- Formula:
- Importance: Consistently high utilization (e.g., >80%) can indicate that a server is under-provisioned and may lead to performance degradation. Consistently low utilization suggests resources are being wasted.
- Memory Utilization: Tracks how much of the available RAM is in use.
- Formula:
- Importance: Unlike CPU, memory exhaustion can cause applications to crash or behave unpredictably. It's also a key indicator of memory leaks in an application.
2. Storage Metrics
- Disk IOPS (Input/Output Operations Per Second): Measures the number of read and write operations a storage volume can perform per second.
- Importance: This is critical for database-driven and transaction-heavy applications. A system can appear healthy on CPU and memory but be completely bottlenecked by slow disk performance.
- Disk Space Usage: Monitors the percentage of storage capacity that is filled.
- Importance: Running out of disk space can cause applications and even the operating system to fail. This is one of the most basic but crucial metrics to track.
3. Network Metrics
- Network Throughput (or Network In/Out): Measures the amount of data transferred over the network in a given period, usually in bytes or bits per second.
- Importance: Helps identify if the network is a bottleneck for data-intensive applications and is essential for tracking data transfer costs.
- Network Latency: The time it takes for a data packet to travel from its source to its destination.
- Importance: High latency directly translates to a poor user experience, making applications feel sluggish even if the server-side processing is fast.
How Metrics are Collected and Visualized
Now that we know what to monitor, let's briefly look at how it's done. Monitoring tools like AWS CloudWatch collect these metrics from resources and present them on dashboards, typically as line graphs plotted against time.
This allows administrators to see trends, spot anomalies, and correlate different metrics. For example, they might notice that a spike in network traffic is causing a corresponding spike in CPU utilization.
To see what this looks like in practice, let's return to the AWS CloudWatch video.
Basics of Amazon CloudWatch and CloudWatch Metrics | AWS Tutorials for Beginners
This part of the video demonstrates how the metrics we just discussed (CPU Utilization, Network In/Out) are actually displayed in a real cloud console.
Watch the segment from 05:02 to 08:14. Observe how the presenter selects different metrics like 'CPU utilization', 'Network in', and 'Network out' for an EC2 instance and how they are graphed over time. This will give you a concrete mental model of what a monitoring dashboard does.
Conclusion
In this lesson, we have established the critical role of resource monitoring in managing a cloud environment. It is the process that provides the data-driven insights necessary to ensure performance, reliability, and cost-efficiency.
Key Takeaways:
- Resource Monitoring is the process of tracking the health and performance of cloud resources by collecting and analyzing data.
- Its primary purpose is to enable proactive management, facilitate quick troubleshooting, and provide data for capacity planning and optimization.
- Key performance metrics are grouped into categories:
- Compute: CPU Utilization, Memory Usage
- Storage: Disk I/O (IOPS), Disk Space
- Network: Throughput (Network In/Out), Latency
- Other important metrics include Error Rate, Application Response Time, and Uptime.
Preview of the Next Lesson:
Monitoring tells us what is happening with our resources. The logical next step is to use that information to make improvements. In our next lesson, we will cover common resource optimization techniques for improving performance and reducing costs, such as rightsizing instances and removing idle resources. You will see how the metrics we learned about today are the direct inputs for any optimization strategy.