Introduction
Welcome back! In our last lesson, you successfully built a kernel module that implemented the classic "top-half/bottom-half" interrupt handling pattern using a workqueue. You learned why deferring work to a process context is crucial for tasks that might sleep, ensuring kernel stability.
Today, we'll investigate what happens when this fundamental mechanism goes awry. This lesson focuses on the learning outcome: Diagnose an interrupt storm scenario, identifying root causes and mitigation strategies. An interrupt storm, where a CPU is flooded with interrupts from a single device, is a critical failure mode that can render a system completely unresponsive. Understanding how to debug and resolve such scenarios is a vital skill for any senior kernel engineer and a frequent topic in high-level technical interviews.
We will explore the symptoms and causes of interrupt storms and then dive into the powerful kernel tools used to pinpoint the offending device and driver, both on a live system and through post-mortem analysis.
1. What is an Interrupt Storm?
An interrupt storm occurs when a hardware device repeatedly generates interrupts at such a high frequency that the CPU spends all its time executing the Interrupt Service Routine (ISR), starving all other tasks, including user-space applications and even essential kernel threads.
Symptoms
- System Sluggishness or Complete Unresponsiveness: The system may feel slow or become completely frozen.
- High CPU Usage in
hiorsi: Tools liketoporhtopwill show one or more CPU cores pegged at nearly 100% utilization, with the time attributed tohi(hardware interrupt) orsi(softirq). - Kernel Log Messages: You might find revealing messages in the kernel log (
dmesg), such as "hard lockup on CPU#" or "irq X: nobody cared".
Root Causes
The issue almost always traces back to the interrupt signal not being properly handled, leading to an immediate re-assertion. The primary causes are:
- Driver Bug: The most common cause. The driver's ISR fails to properly "acknowledge" the interrupt by clearing the specific status bit in the device's hardware registers. When the ISR finishes, the device's interrupt line is still active, causing it to fire again instantly.
- Hardware Misconfiguration (Level- vs. Edge-Triggered): Interrupts can be edge-triggered (firing only on a signal change, e.g., low to high) or level-triggered (firing as long as the signal is at a certain level, e.g., high).
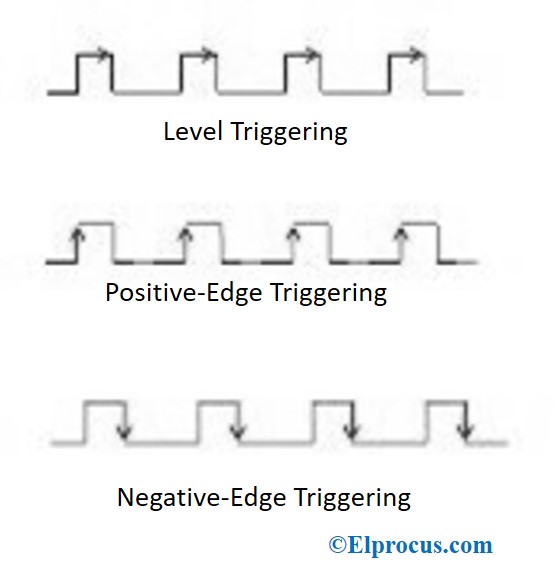
- Faulty Hardware: Less common, but a hardware component can fail in a way that causes it to continuously assert its interrupt line regardless of driver actions.
2. Diagnosing an Interrupt Storm
Your primary goal is to identify which IRQ line is misbehaving and which driver is responsible.
Step 1: Initial Triage with /proc/interrupts
The first place to look on a (partially) responsive system is /proc/interrupts. This file gives a real-time count of interrupts per IRQ line, broken down by CPU.
Monitoring and Tuning the Linux Networking Stack: Receiving Data
The article "Monitoring and Tuning the Linux Networking Stack" provides a good explanation of how to read /proc/interrupts in the context of network devices, which are a common source of high interrupt load.
Please read the section "Hardware interrupt requests". Focus on how to read the output of /proc/interrupts and what it tells you about interrupt distribution across CPUs. Note the important caveat that this file doesn't tell the whole story due to NAPI and interrupt coalescing, but it's our starting point for spotting an anomaly.
How to Use It:
Run watch -n 1 'cat /proc/interrupts'. You are looking for a counter on a specific IRQ line that is increasing at an astronomical rate (thousands or millions per second). This will point you to the misbehaving IRQ number. The rightmost column will tell you the name of the registered device/driver, giving you an immediate suspect.
Example output during an storm might show:
           CPU0       CPU1       CPU2       CPU3
...
 66:  1834593821          0          0          0   IR-PCI-MSI-edge   eth0-TxRx-0
...
Here, IRQ 66, handled by CPU0 for device eth0-TxRx-0, is firing excessively.
Step 2: Using Kernel Lockup Detectors
Often, an interrupt storm is so severe it causes a hard lockup. A hard lockup occurs when a CPU gets stuck in kernel mode with interrupts disabled for an extended period, preventing even the scheduler's timer interrupt from being serviced.
The Linux kernel has built-in watchdog timers to detect this.
Mentorship Session: Linux Kernel Debugging Tricks of the Trade
To understand how the kernel detects these hangs, watch this section from the "Linux Kernel Debugging Tricks of the Trade" webinar by Joel Fernandes. He demonstrates how to trigger an IPI (Inter-Processor Interrupt) flood—a software-induced interrupt storm—and how the hard lockup detector catches it and provides a stack trace.
Watch from 01:03:06 to 01:07:11. Pay close attention to the distinction between a soft and hard lockup, the sysctl knobs used to configure the watchdog, and the final dmesg output that shows the "hard lockup on CPU#" message and the critical backtrace of the stuck CPU.
To use this feature, you need to ensure the following kernel configurations are enabled (they usually are in modern distribution kernels):
CONFIG_LOCKUP_DETECTOR=yCONFIG_HARDLOCKUP_DETECTOR=y
When a hard lockup is detected, the kernel will print a message to the console and kernel log, including a stack trace of the CPU that is stuck. This stack trace is your "smoking gun"—it will typically show the CPU spinning inside the problematic ISR.
Step 3: Post-Mortem Analysis with Ftrace "Flight Recorder"
What if the system crashes and reboots before you can investigate? For these cases, you can configure the kernel to act like an airplane's flight recorder, dumping a detailed trace buffer upon crashing.
Mentorship Session: Linux Kernel Debugging Tricks of the Trade
The same webinar explains this powerful "flight recorder" technique. Joel shows how to use kernel boot parameters to automatically dump the ftrace buffer to the console when a panic or other critical event occurs.
Watch from 01:07:17 to 01:14:34. Focus on the boot parameters ftrace_dump_on_oops and how they can be combined with panic_on_warn=1 or hardlockup_panic=1 (set via sysctl or boot arg) to capture the state of the system right before a crash caused by a lockup.
Here is a practical recipe for capturing a trace from an interrupt storm that causes a hang:
- Enable kernel configs:
CONFIG_FTRACE=yCONFIG_FUNCTION_TRACER=yCONFIG_HARDLOCKUP_DETECTOR=y
- Add kernel boot parameters:
ftrace_dump_on_oopssysctl.kernel.hardlockup_panic=1(This tells the kernel to panic when a hard lockup is detected, rather than just printing a warning).
When the interrupt storm causes a hard lockup, the kernel will panic. The ftrace_dump_on_oops command will then trigger, dumping the contents of the ftrace buffer to the console/log. This trace will show you the sequence of functions that executed right before the hang, providing invaluable clues to the root cause.
3. Mitigation Strategies
Once diagnosed, how do you fix or mitigate an interrupt storm?
1. Correct the Driver Code (The Real Fix)
The definitive solution is to fix the bug in the driver. This involves carefully reviewing the device's datasheet and ensuring the ISR performs the correct sequence of register writes to acknowledge and clear the interrupt source before returning IRQ_HANDLED.
2. Kernel Self-Defense
The kernel has a built-in defense mechanism. If an interrupt fires many times but no registered handler returns IRQ_HANDLED (or if an IRQ line fires with no handler at all), the kernel will assume it's a spurious or stuck interrupt and disable the line.

3. Interrupt Coalescing
For devices that can generate a high volume of legitimate interrupts (like high-speed network cards), an interrupt storm can occur simply from overwhelming load. Interrupt Coalescing is a hardware feature that mitigates this by batching events. Instead of generating an IRQ for every single packet, the NIC waits until it has received a certain number of packets (rx-frames) or a certain amount of time has passed (rx-usecs).
Monitoring and Tuning the Linux Networking Stack: Receiving Data
Interrupt coalescing is a key preventative strategy. This article explains it clearly.
Read the section "Interrupt coalescing". Focus on the trade-off it presents (throughput vs. latency) and how to use the ethtool -c and ethtool -C commands to view and modify these hardware-level settings.
4. NAPI (New API)
For networking devices, NAPI is the ultimate architectural solution. As we've touched on, NAPI implements a hybrid interrupt/polling model.
- The first packet arrival triggers a hardware interrupt.
- The ISR does the bare minimum: it disables further interrupts from the NIC and schedules a softirq (
NET_RX_SOFTIRQ) to start polling the device. - The
ksoftirqdthread then pulls packets from the device's ring buffer in a tight loop (thepollfunction), completely avoiding any further hardware interrupts. - Once the ring buffer is empty, NAPI re-enables interrupts and goes back to sleep.
This design inherently prevents interrupt storms from high traffic, as the vast majority of packets are processed in a polling context without generating a hardware IRQ. You can read more about this in the resource LINK from packagecloud.io, specifically sections on "NAPI" and "SoftIRQs".
4. Interview Scenario
Scenario: You're brought in to debug a custom embedded system using a new FPGA-based network accelerator. Under heavy traffic, the entire system freezes. top is inaccessible, but you have a serial console. You manage to reboot and see from /proc/interrupts that the IRQ associated with your accelerator is firing millions of times per second, exclusively on CPU2. What are the three most likely root causes you would investigate, and what is your primary debugging strategy?
Click for Analysis
-
Top 3 Likely Root Causes:
- Driver ISR Bug: The most likely culprit. The ISR for the accelerator driver is not writing the correct value to the correct register on the FPGA to clear the "packet received" interrupt condition.
- Level-Triggered Misconfiguration: The interrupt line between the FPGA and the CPU is configured as level-triggered, but the ISR is not de-asserting it before exiting. The line remains high, causing an immediate re-trigger.
- FPGA Logic Bug: There could be a bug in the FPGA's Verilog/VHDL that causes the interrupt line to get "stuck" in an asserted state after the first packet event.
-
Primary Debugging Strategy:
- Isolate and Verify: First, I would simplify the test case. Can I trigger the storm with a single packet? This helps differentiate a load issue from a fundamental handling bug.
- Enable Post-Mortem Tracing: Since the system freezes, live debugging is unreliable. I would immediately enable
hardlockup_panic=1andftrace_dump_on_oopsas boot arguments. - Reproduce and Analyze: I'd reproduce the hang. The system will now panic and dump the ftrace buffer. I would analyze the resulting trace and the panic's stack trace. I expect to see the CPU spinning endlessly within my accelerator's ISR, confirming the location of the bug.
- Code and Register Review: Armed with the trace, I would meticulously review the driver's ISR code against the FPGA's register documentation, paying extremely close attention to the interrupt status and acknowledgement registers. I'd likely add
printkor dynamic debug statements to trace the register values being read and written right before the hang.
Conclusion
In this lesson, we delved into the complex but critical world of interrupt-related system failures. You now have a systematic approach to identifying, diagnosing, and mitigating interrupt storms—a skill that separates senior from junior kernel developers.
Key Takeaways:
- An interrupt storm is a high-frequency interrupt flood from a single source, often caused by a driver bug where the ISR fails to acknowledge the interrupt correctly.
- Your first diagnostic tool is
/proc/interruptsto spot the runaway IRQ line. - The kernel's hard lockup detector is your best friend for catching the problem on a live system and providing a stack trace.
- For unresponsive systems, the
ftrace"flight recorder" (ftrace_dump_on_oops+hardlockup_panic=1) is an indispensable tool for post-mortem analysis. - While the true fix is in the driver, mitigation techniques like interrupt coalescing and architectural patterns like NAPI are essential for handling high-frequency event sources.
In our next lesson, we will move up a layer of abstraction to explore the framework that manages all these devices and drivers. We will describe the Linux device model (buses, devices, drivers) and its representation in sysfs.