Introduction
Welcome back. In our last lesson, we mastered post-mortem debugging by dissecting a vmcore file with the crash utility. That workflow is indispensable when analyzing a system that has already failed. But what if you need to watch the kernel's behavior in real-time, especially in a virtualized environment? How do you catch bugs that happen during the boot process or debug a new driver as it initializes within a guest OS?
This lesson transitions from post-mortem analysis to live, interactive debugging. We will tackle the learning outcome: Debug guest kernel code using QEMU's GDB stub to step through virtualized kernel execution. You will learn how to pause a guest kernel at will, inspect its state, and step through its code line-by-line, all from a GDB session running on your host machine. This is a foundational skill for anyone working with KVM, QEMU, or developing kernel code for virtualized systems.
1. The Architecture of Live Kernel Debugging
Before we dive into the commands, it's crucial to understand the setup. Unlike crash, which analyzes a static file, live debugging involves a client-server relationship.
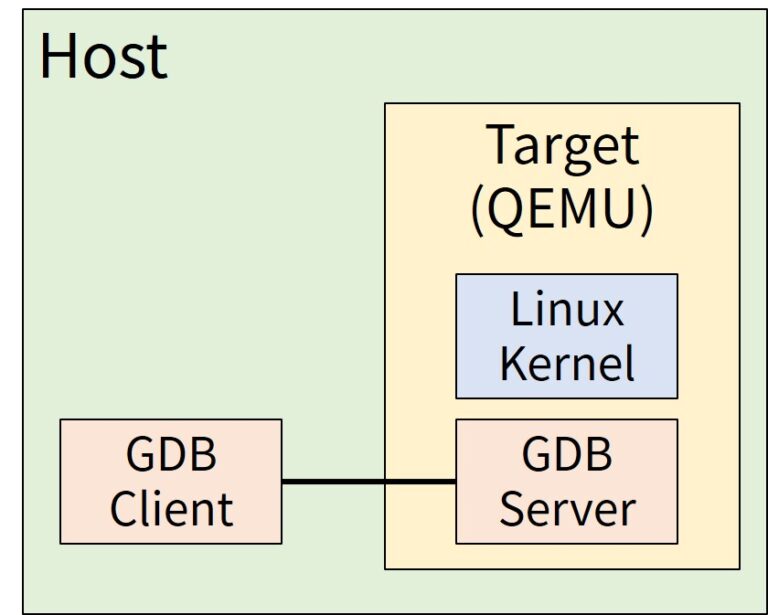
The key components are:
- GDB Client (on the Host): This is the standard GDB you run from your terminal. It sends commands like "set breakpoint," "step," and "read memory."
- QEMU GDB Stub (Server): When enabled, QEMU starts a small server that listens on a TCP port. It receives commands from the GDB client and translates them into actions within the virtual machine, such as pausing the virtual CPU, modifying memory, or reading registers.
- Guest Kernel (in QEMU): This is the kernel we want to debug. It must be compiled with debugging symbols for the GDB client to make sense of its code and data.
2. Preparing the Kernel for Debugging
For GDB to be effective, the kernel it's debugging must be compiled with specific options. A standard production kernel is stripped of most of the information a debugger needs.
Here are the essential menuconfig settings:
CONFIG_DEBUG_INFO=y: This is the most critical option. It instructs the compiler to include DWARF debugging symbols in the finalvmlinuxfile. This provides the mapping between memory addresses and source code lines, function names, and variables.CONFIG_GDB_SCRIPTS=y: This enables support for special Python helper scripts that come with the kernel source. These scripts provide kernel-aware commands within GDB (e.g.,lx-dmesg), which we'll explore later.CONFIG_FRAME_POINTER=y: This ensures the compiler maintains the frame pointer in function calls, which allows GDB to generate much more reliable stack backtraces (bt).- Disabling KASLR: Kernel Address Space Layout Randomization (KASLR) is a security feature that loads the kernel at a different memory address each time it boots. While great for security, it makes setting breakpoints impossible for a debugger, as the address of a function will change on every boot. You can disable it in two ways:
- Build-time: Set
CONFIG_RANDOMIZE_BASE=nin your kernel configuration. - Run-time: Add
nokaslrto the kernel's boot command line. This is the more flexible and common approach.
- Build-time: Set
This first video provides a quick demonstration of setting the necessary options and building the kernel.
Exploring How Linux Boots with GDB
The video 'Exploring How Linux Boots with GDB' by Nir Lichtman starts by showing exactly how to configure and build a kernel for debugging. This covers the practical steps of enabling the required options.
Watch the first part of the video from 00:17 to 01:42. Focus on these key actions: Using make menuconfig to find and enable CONFIG_GDB_SCRIPTS. Building the kernel with make. Building the GDB helper scripts with make scripts_gdb.
3. Launching QEMU with the GDB Stub
Once you have a debug-enabled kernel (vmlinux), you can launch it with QEMU using two special flags that are essential for debugging.
-s: This is a shorthand for-gdb tcp::1234. It tells QEMU to start its GDB stub and wait for a connection from a GDB client on TCP port 1234.-S(uppercase): This flag tells QEMU to "freeze" the virtual CPU at the very first instruction. The guest will not start booting until you connect with GDB and issue thecontinuecommand. This is absolutely critical for debugging anything in the early boot process.
Here is a typical QEMU command line for launching a kernel for debugging:
qemu-system-x86_64 \
    -kernel /path/to/linux/arch/x86/boot/bzImage \
    -append "console=ttyS0 nokaslr" \
    -initrd /path/to/initrd.img \
    -s \
    -S
Note: While you can boot the vmlinux file directly with the -kernel option, using the compressed bzImage and an initrd is a more realistic setup. The debugging symbols will be loaded separately from the vmlinux file in GDB.
The video you just watched also demonstrates this step perfectly.
Exploring How Linux Boots with GDB
Let's continue with the same video, which now shows how to launch QEMU.
Watch from 02:25 to 03:43. Pay close attention to the explanation of the -s, -S, and -append "nokaslr" options. Notice how the QEMU window appears but is 'frozen', waiting for the debugger.
4. Stepping Through the Kernel with GDB
Now for the main event. With QEMU waiting, you can launch GDB on your host and take control of the guest kernel.
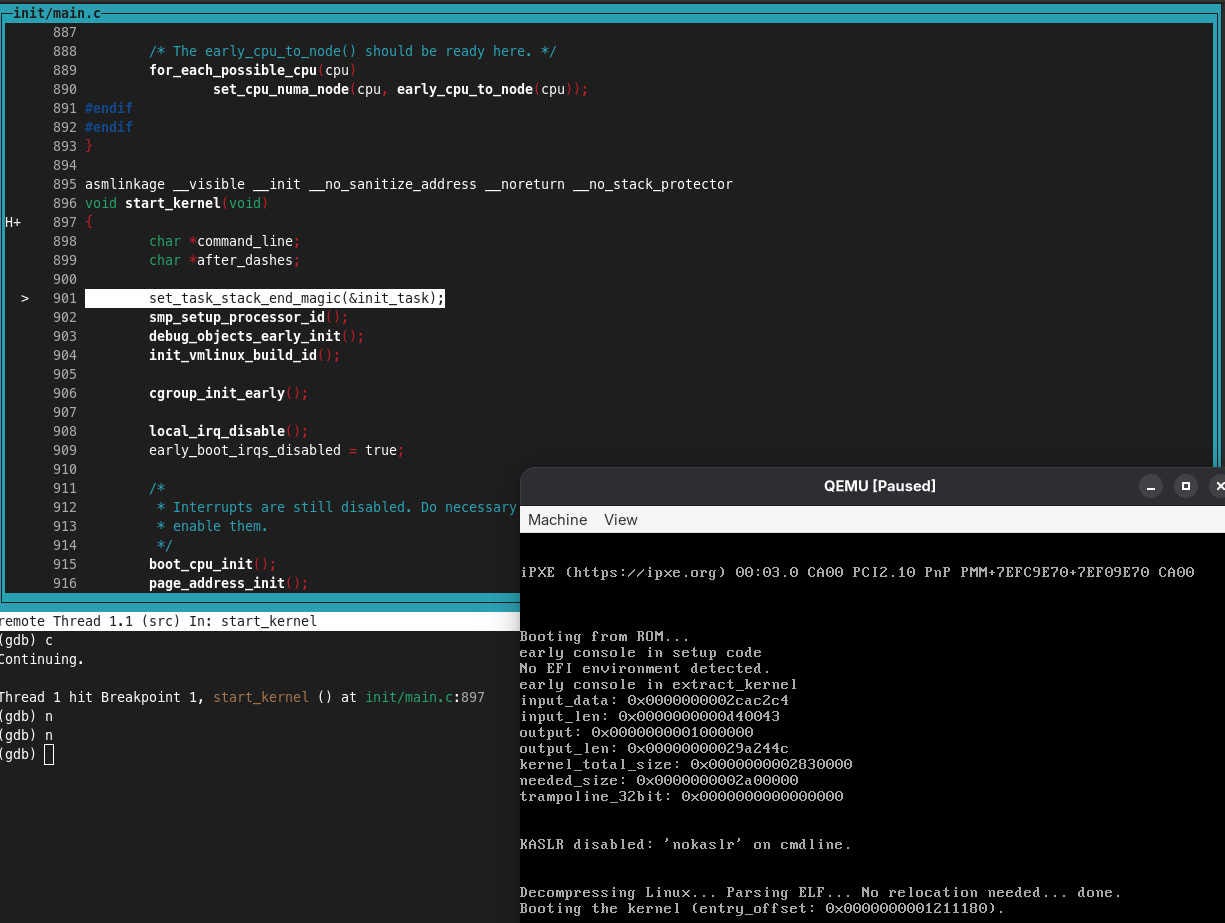
Here is the step-by-step workflow:
-
Launch GDB: In your kernel source directory, launch GDB and point it to the
vmlinuxfile that contains the debug symbols.gdb ./vmlinuxImportant: Using
./vmlinuxfrom the root of the kernel source tree is crucial. This allows GDB to automatically find the source files and the Python helper scripts (vmlinux-gdb.py). You may need to add the kernel source path to GDB'ssafe-pathas shown in the video if it complains about auto-loading scripts. -
Connect to QEMU: Inside GDB, use the
target remotecommand to connect to the QEMU GDB stub.(gdb) target remote :1234 -
Set a Breakpoint: Since the kernel is paused very early in the boot process (likely still in the bootloader), you can set a breakpoint on any function you want to inspect, like
start_kernel. For early boot code, it's best to use a hardware breakpoint (hbreakorhb) as it doesn't rely on the kernel's memory management being fully initialized.(gdb) hb start_kernel -
Continue Execution: Tell the guest to start running. It will execute until it hits your breakpoint.
(gdb) cThe kernel will now boot and promptly stop at the beginning of the
start_kernelfunction, giving you full control. -
Debug!: You can now use standard GDB commands to inspect the kernel:
n(next): Step to the next line of code (over function calls).s(step): Step to the next line of code (into function calls).bt(backtrace): Show the current call stack.p <variable>(print): Print the value of a variable.list: Show the source code around the current line.
This final clip from the video demonstrates the entire interactive process.
Exploring How Linux Boots with GDB
This last segment of the video puts everything together, showing the GDB connection, setting a breakpoint, and stepping through the kernel's initialization code.
Watch from 03:43 to 06:21. Follow along as the presenter: Launches GDB with vmlinux. Connects to QEMU with target remote. Sets a hardware breakpoint on kernel_init. Uses c, n, and s to navigate through the boot process.
GDB Text User Interface (TUI)
For a more integrated experience, you can launch GDB in TUI mode with the -tui flag. This gives you a split-screen view with your source code, assembly, and GDB prompt, which many developers find more efficient than using the list command repeatedly.
gdb -tui ./vmlinux
The video 'Debugging the Linux Kernel' from the 'Write your own Operating System' channel provides a nice demonstration of this enhanced interface.
Watch from 34:25 to 38:54. You don't need to follow every command, but observe how the TUI mode provides a persistent view of the source code as the user steps through the start_kernel function.
5. Using Kernel-Specific GDB Helpers
Standard GDB commands are powerful, but they are not inherently aware of Linux kernel data structures. This is where the Python scripts enabled by CONFIG_GDB_SCRIPTS come in. They add a set of lx-* commands to GDB that can parse kernel-specific data.
Debugging kernel and modules via gdb
The official kernel documentation, 'Debugging kernel and modules via gdb', provides a concise list of these helper commands. Let's review them.
Read the section titled 'Examples of using the Linux-provided gdb helpers'. This short section introduces powerful commands that are direct parallels to what you learned to do in the crash utility.
Here are some of the most useful commands you just read about:
(gdb) lx-dmesg: Dumps the kernel log buffer, just like thelogcommand incrash.(gdb) lx-ps: Prints a process list, similar topsincrash.(gdb) p $lx_current(): Prints thetask_structof the currently executing task on the active CPU.(gdb) lx-symbols: Loads the symbols for all currently loaded kernel modules. This is essential if you need to set a breakpoint in a dynamically loaded driver.
Using these commands bridges the gap between a generic debugger and a true kernel-aware debugging tool, significantly speeding up your workflow.
Conclusion
You have now learned the complete workflow for live, interactive debugging of a guest kernel. This technique is invaluable for tackling complex issues that are difficult to reproduce or happen too early in the boot process to be logged effectively. It gives you an unparalleled view into the inner workings of the kernel as it executes.
Key Takeaways:
- The Setup is Key: The process hinges on a debug-enabled kernel (
CONFIG_DEBUG_INFO,CONFIG_GDB_SCRIPTS), launching QEMU with the-sand-Sflags, and disabling KASLR (nokaslr). - Client-Server Model: GDB acts as a client controlling the guest kernel via the GDB stub built into QEMU.
vmlinuxis your Map: GDB needs the unstrippedvmlinuxfile to resolve addresses to source code.- Kernel Helpers are Powerful: Use the
lx-*commands to quickly inspect kernel-specific data structures without manually traversing pointers in GDB.
Interview Scenario:
Interviewer: "I'm developing a new platform device driver. It works when loaded as a module on a running system, but when I build it into the kernel, the system hangs during boot. I suspect a race condition in my driver's probe function. How would you debug this?"
Your response should detail the process you learned today:
- First, ensure the kernel is compiled with debug symbols (
CONFIG_DEBUG_INFO,CONFIG_GDB_SCRIPTS) and KASLR is disabled (nokaslron the boot command line). - Launch the kernel in QEMU with the
-sand-Sflags to start the GDB stub and freeze the guest on boot. - Connect to the guest from a GDB session on the host that has loaded the
vmlinuxsymbols. - Set a hardware breakpoint (
hbreak) on the driver's probe function (e.g.,hbreak my_driver_probe). - Continue execution (
c). GDB will stop inside the probe function. - From there, you can step through the code line-by-line (
nors) to observe the state of variables and hardware registers, allowing you to pinpoint the cause of the hang.
Preview of the Next Lesson:
Interactive debugging with GDB is powerful for finding logical errors, but some of the most difficult bugs in kernel code involve subtle memory corruption. In our next lesson, "Use the Kernel Memory Sanitizer (KASAN) to detect memory corruption bugs like use-after-free," we will explore a powerful dynamic analysis tool that can automatically detect a whole class of dangerous memory bugs at runtime.