Introduction
Welcome back! In our last lesson, we explored how to use KASAN to detect memory corruption bugs like use-after-free and buffer overflows at the exact moment they occur. KASAN is incredibly powerful for bugs involving invalid memory access. However, it won't help us with another insidious class of memory bugs: memory leaks.
This lesson addresses the learning outcome: Use the kmemleak tool to detect and analyze kernel memory leaks. A memory leak occurs when memory is allocated but the pointer to it is lost, meaning it can never be freed. This leads to a gradual loss of available memory, eventually degrading system performance or causing a crash. We will learn how kmemleak, the kernel's built-in leak detector, works and how to use it to hunt down and fix these resource-draining bugs.
1. Understanding Kernel Memory Leaks
While KASAN catches illegal memory operations, a memory leak is a perfectly legal, but logically flawed, sequence of operations.
Consider this simple logic:
- A pointer
ptris created. - Memory is allocated and its address is assigned to
ptr. - The
ptrvariable is reassigned or goes out of scope withoutkfree()being called on the original memory.
At this point, the kernel has no way to reclaim that memory block because no active reference to it exists. The memory is "lost". While a small leak might seem harmless, in a long-running embedded system, even a tiny leak in a frequently executed code path can drain all available memory, leading to allocation failures, OOM (Out Of Memory) killer invocations, and system failure.
kmemleak is designed specifically to find these logically leaked objects.
2. How kmemleak Works: A Tracing Garbage Collector for Debugging
kmemleak can be thought of as the kernel's equivalent of the user-space Valgrind tool. It operates on a "mark-and-sweep" principle, similar to a tracing garbage collector. Unlike KASAN, which is always watching, kmemleak is a passive tool that only finds leaks when you ask it to perform a scan.
The process involves two main phases:
- Object Tracking:
kmemleakhooks into the kernel's main memory allocators (kmalloc,vmalloc, etc.). Every time memory is allocated,kmemleakrecords its address, size, and the allocation call stack in a metadata structure. When memory is freed, the corresponding metadata is removed. - Memory Scanning (Mark-and-Sweep): When a scan is triggered,
kmemleakperforms a comprehensive search of all kernel memory to find which allocated objects are still reachable.
Let's explore the theory behind this scanning mechanism.
Linux Kernel Memory Leak Detection
The presentation 'Linux Kernel Memory Leak Detection' by kmemleak's author, Catalin Marinas, provides an excellent overview of its internal algorithm. Let's look at how it models the problem.
First, read the 'Overview' section (starts on slide 4) to understand the garbage collector analogy. Then, review the 'Memory Scanning' section (starts on slide 8). Focus on the concept of 'tri-colour marking' (White, Grey, Black sets) and how the scan progresses from root memory blocks to find all referenced objects.
As the reading explains, the scanning algorithm works as follows:
- Initialization: At the start of a scan, all tracked objects are placed in the White set (potential leaks).
- Marking the Roots:
kmemleakscans all known "root" memory areas where a valid pointer might be stored. This includes the kernel's data and BSS sections, task stacks, and CPU registers. Any object whose address is found in these areas is moved from the White set to the Grey set (confirmed reachable). - Recursive Scan: The scanner then iterates through the Grey set. It takes an object, scans its contents for pointers to other objects, and moves any referenced White objects to the Grey set. Once an object has been fully scanned for pointers, it is moved to the Black set (reachable and scanned).
- Reporting: This process continues until the Grey set is empty. At this point, any objects remaining in the White set are considered unreferenced and are reported as suspected memory leaks.
This approach is powerful but has limitations, primarily the potential for false positives (reporting a leak that isn't one) and false negatives (missing a real leak). This can happen if a pointer is stored in a modified format (e.g., as a physical address) or if a random integer value happens to match the address of a leaked object.
3. Practical Guide: Enabling and Using kmemleak
Now let's move from theory to practice. Using kmemleak involves three steps: enabling it, triggering a scan, and analyzing the output.
Step 1: Enabling kmemleak
First, you must compile your kernel with kmemleak support. This is done via make menuconfig.

The key options are:
Kernel hacking->Memory Debugging->Kernel memory leak detector(CONFIG_DEBUG_KMEMLEAK=y)
After configuring and building your kernel, you also need to enable kmemleak at boot time by adding kmemleak=on to the kernel command line in your bootloader configuration.
Step 2: Triggering a Scan
kmemleak interacts with the user via the debugfs filesystem. First, ensure debugfs is mounted:
sudo mount -t debugfs none /sys/kernel/debug
The kmemleak interface is a file located at /sys/kernel/debug/kmemleak. You can control it by writing commands to this file.
Practical Linux Kernel Debugging: From pr_debug() to KASAN ...
The article 'Practical Linux Kernel Debugging' provides a concise summary of how to interact with the kmemleak interface.
Read the section 'kmemleak: Memory Leak Detector'. Focus on the commands used to trigger a scan and view the report. This will show you the basic workflow.
The most important commands are:
- Trigger a scan:
echo scan > /sys/kernel/debug/kmemleak - View the report:
cat /sys/kernel/debug/kmemleak - Clear the report:
echo clear > /sys/kernel/debug/kmemleak(This marks all current leaks as "grey" so they aren't reported again, which is useful for focusing on new leaks).
When kmemleak finds new leaks during a scan, it will also print a message to the kernel log (dmesg), like this:kmemleak: N new suspected memory leaks (see /sys/kernel/debug/kmemleak)
Step 3: Analyzing the Report
The report generated by cat /sys/kernel/debug/kmemleak is where you'll do your detective work.
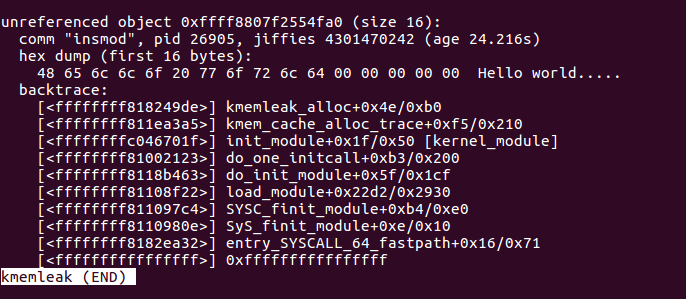
Let's break down this report:
unreferenced object ...: The virtual address of the leaked block of memory.size ...: The size of the allocation in bytes.comm "...", pid ...: The command name and process ID of the task that allocated the memory.hex dump ...: The first few bytes of data inside the leaked block. This can be a huge clue, as it might contain recognizable strings or data structure signatures.backtrace: ...: This is the most important part. It is the full call stack at the time the memory was allocated. By analyzing this stack, you can pinpoint the exact line of code responsible for the allocation that was ultimately leaked.
4. Interview Scenario: Debugging a Leak in a Driver
Let's put this all together in a scenario you might encounter in a high-level interview.
The Problem: You've written a character device driver. When testing, you notice that the system's free memory slowly decreases over time, but only when your test application repeatedly opens and closes the device file. You suspect a memory leak in your driver's open or release path.
Buggy Driver Code:
#include <linux/module.h>
#include <linux/fs.h>
#include <linux/slab.h>

// This function intentionally leaks memory.
static void __leak(void) {
    char *leaked_buffer;
    leaked_buffer = kmalloc(128, GFP_KERNEL);
    // BUG: We allocate memory but never store the pointer or free it.
    strcpy(leaked_buffer, "This data is now lost forever...");
}

static int my_dev_open(struct inode *inode, struct file *file) {
    pr_info("my_dev: device opened\n");
    __leak(); // Let's trigger our leak.
    return 0;
}

static int my_dev_release(struct inode *inode, struct file *file) {
    pr_info("my_dev: device released\n");
    return 0;
}

// File operations structure
// ...
Your Analysis and Debugging Workflow:
-
Tool Selection: The symptoms (slow memory depletion, not a crash) strongly suggest a memory leak, not memory corruption.
kmemleakis the correct tool. KASAN would not detect this bug. -
Reproduction:
- Build the kernel with
kmemleakenabled (CONFIG_DEBUG_KMEMLEAK=y). - Boot the new kernel with the
kmemleak=oncommand-line parameter. - Load your buggy driver module.
- Run a script that repeatedly opens and closes the device file to trigger the leak multiple times:
for i in {1..100}; do exec 3<>/dev/my_dev; exec 3<&-; done
- Build the kernel with
-
Detection:
- Wait for the script to finish.
- Trigger a memory scan:
echo scan | sudo tee /sys/kernel/debug/kmemleak - Check
dmesgfor a notification about new suspected leaks.
-
Investigation:
- Examine the full report:
cat /sys/kernel/debug/kmemleak - You would see a report similar to this:
unreferenced object 0xffff888103e8c800 (size 128): comm "bash", pid 1234, jiffies ... hex dump (first 32 bytes): 54 68 69 73 20 64 61 74 61 20 69 73 20 6e 6f 77 This data is now 20 6c 6f 73 74 20 66 6f 72 65 76 65 72 2e 2e 2e lost forever... backtrace: [<...>] kmemleak_alloc+0x... [<...>] __kmalloc+0x... [<...>] __leak+0x2a/0x50 [my_buggy_driver] [<...>] my_dev_open+0x15/0x30 [my_buggy_driver] [<...>] chrdev_open+0x... ... (rest of VFS call chain) ... - Examine the full report:
-
Root Cause:
- The
hex dumpconfirms it's the string from your__leakfunction. - The
backtraceis the smoking gun. It shows thekmallocwas called from__leak, which in turn was called frommy_dev_open. - Looking at the code for
__leak, it's immediately obvious thatleaked_bufferis a local variable, and its value is lost when the function returns, leaking the allocated memory.
- The
By following this methodical process, kmemleak leads you directly from a vague symptom (disappearing memory) to the precise line of code causing the problem.
Conclusion
You have now added another essential tool to your advanced debugging toolkit. While KASAN helps you find bugs related to memory safety, kmemleak helps you find bugs related to memory lifetime management.
Key Takeaways:
- Memory Leaks vs. Corruption: Leaks are about allocated memory that is no longer referenced, while corruption is about invalid memory access (out-of-bounds, use-after-free).
kmemleakis a Mark-and-Sweep Scanner: It tracks all allocations and periodically scans memory from root pointers to find unreachable (leaked) objects.- The Workflow is Key: Enable
kmemleakat build/boot time, trigger scans viadebugfs, and analyze the backtrace in the report to find the source of the allocation. - The Backtrace is Your Guide: The most valuable piece of information in a
kmemleakreport is the allocation call stack, which points you directly to the source of the problem.
Preview of the Next Lesson:
So far in this module, we've focused on debugging a live, running kernel. But what happens when a bug is so severe that it causes a complete system crash (a kernel panic)? In our final lesson of this module, "Analyze a kernel crash dump using the 'crash' utility to perform a post-mortem root cause analysis," we will learn how to configure a system to save the kernel's state upon a crash and how to analyze that "crash dump" offline to find out what went wrong.