Hello and welcome back.
In our last few lessons, we've focused on the critical internal reporting processes that an FP&A analyst drives, culminating in the creation of a polished board presentation. We mastered the art of consolidating data and commentary to tell a strategic story to the company's leadership.
Today, we pivot from the boardroom to the open market. This lesson will focus on one of the highest-stakes responsibilities of a finance team in a public company: communicating financial expectations to investors. We will address the learning outcome: Describe the purpose and key components of an earnings guidance model used for investor relations.
This is a crucial topic for your goal of becoming a high-level FP&A professional. While junior analysts might support the process, understanding how guidance is set and communicated is key to operating at a strategic level within a public company's finance organization.
1. What is Earnings Guidance and Why Do Companies Provide It?
At its core, earnings guidance is a company's official forecast of its own future financial performance, shared publicly with investors, analysts, and the market at large. It's management's attempt to set expectations for the upcoming quarter or year.
But why do it? It's a heavily debated topic with significant strategic implications. To understand its purpose, we need to weigh the potential benefits against the drawbacks.
Earnings Guidance Best Practices: To Guide or Not to Guide?
Let's begin by reading an article from 'Pulse by GetFeatured.Org' that provides an excellent overview of the strategic thinking behind earnings guidance.
Please read the first three sections: 'The Earnings Guidance Dilemma,' 'The Current Guidance Landscape,' and 'The Case For and Against Guidance.' As you read, focus on the core arguments for why a company would choose to provide guidance and the risks it entails.
As you just read, the decision to provide guidance is a strategic balancing act. The primary purposes can be summarized as:
- Managing Volatility: By setting clear expectations, companies aim to prevent major stock price swings that can result from "earnings surprises" (missing or wildly exceeding analyst estimates).
- Controlling the Narrative: Guidance allows a company to frame its own story and prospects, rather than letting market speculation and analyst models dictate the conversation.
- Building Credibility: A track record of consistently meeting or beating guidance builds trust and credibility with the investment community.
- Supporting Valuation: The forecasts provided in guidance serve as a direct input for the valuation models (like the DCF models we'll build later) used by Wall Street analysts.
However, these benefits come with risks like promoting a short-term focus, creating pressure to hit targets at any cost, and potential legal exposure if the guidance proves to be materially wrong.
2. The "Model" Behind the Guidance
The term "earnings guidance model" can be slightly misleading. It isn't a single, standardized Excel template. Rather, it's a comprehensive process supported by a suite of analytical tools, rigorous internal controls, and cross-functional collaboration. The FP&A team is the engine of this process.
The foundation of any guidance is the company's internal operating model. This is the same detailed financial model used for budgeting, forecasting, and board reporting.
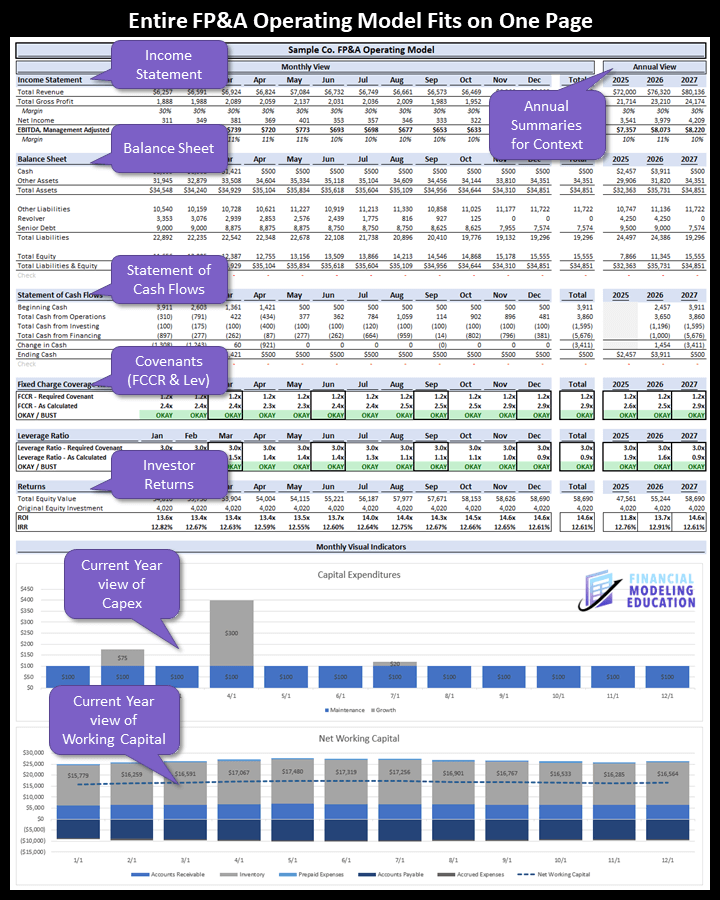
The guidance process begins by running this model to generate a baseline forecast. But that's just the first step. The real work is in pressure-testing this forecast and building a framework around it that can be communicated externally.
3. Key Components of an Earnings Guidance Model
A robust guidance model or process has four key components. It defines what you'll guide on, how you'll build in uncertainty, who is involved, and how it's communicated.
Component 1: The Metrics & Timeframe
A company must decide which specific financial and operational metrics it will forecast. This is rarely just Earnings Per Share (EPS).
Best Practice Guidelines Governing Analyst
Let's turn to a professional guide from the CFA Institute to understand what constitutes best practice for the content of guidance. We will also refer back to the 'Earnings Guidance Best Practices' article for more on metric selection.
In this CFA Institute document, please read the section 'Appendix A: Additional Guidance for Corporate Issuers Providing Earnings Guidance.' Pay close attention to the bullet points that list the recommended information to provide.
Combining insights from the CFA guidelines and industry best practices, the key components of the "what" are:
- Key Financial Metrics: These often include a range for Revenue, Gross Margin, Operating Margin, and EPS. Many companies also guide on non-GAAP metrics like Adjusted EBITDA, which they believe better reflects core performance.
- Operational Drivers: For many industries, operational metrics are more telling than financial outcomes. A software company might guide on Annual Recurring Revenue (ARR), a retailer on same-store sales growth, or an energy company on production volume.
- Timeframe: Companies must choose a horizon. A common trend is to provide detailed annual guidance and update it quarterly, moving away from the intense short-term pressure of quarterly guidance.
Component 2: Assumptions and Sensitivity Analysis
A forecast is only as good as its assumptions. A critical component of a guidance model is to not only state these assumptions but also to quantify their impact. Your engineering background gives you an intuitive grasp of how systems behave when variables change; the same principle applies here.
Best practice, as noted by the CFA Institute, is to provide a sensitivity analysis. This demonstrates to investors that the company has a deep understanding of its business drivers and the potential risks to its forecast. The FP&A analyst is responsible for building these analyses.

The guidance model must be dynamic enough to answer questions like:
- "If our raw material costs increase by 5%, what is the impact on Gross Margin and EPS?"
- "What happens to our revenue forecast if a major new product launch is delayed by one quarter?"
- "For every 1% change in revenue growth, what is the corresponding change in our operating margin?"
Component 3: A Robust Internal Process
Developing guidance is a team sport, with FP&A acting as the quarterback. It's a high-stakes process requiring strict controls.
Earnings Guidance Best Practices: To Guide or Not to Guide?
Let's revisit the 'Earnings Guidance Best Practices' article to understand the process and communication components.
Please read the section 'Guidance Best Practices.' Focus on the subsections 'Develop a Robust Guidance Process' and 'Communicate Effectively.' This outlines the internal machinery required to produce and deliver guidance.
A strong process includes:
- A Cross-Functional Committee: Typically includes the CFO, Head of FP&A, Head of Investor Relations (IR), and legal counsel. Heads of Sales and Operations are also key to validate top-line and cost assumptions.
- Rigorous Forecasting: Using multiple methods (e.g., driver-based, statistical) and building in appropriate buffers for uncertainty.
- Clear Documentation: Assumptions are meticulously documented so that if guidance needs to be updated later, the team can clearly explain what changed.
Test your understanding!
You are the FP&A analyst for a publicly-traded manufacturing company. In the quarterly guidance meeting, the Head of Sales reports strong early orders for a new product, pushing for an aggressive revenue forecast. However, the Head of Operations warns that a key supplier is facing disruptions, which could delay production and increase costs.
As the analyst managing the model, what is your role and what analysis should you present to the committee?
Show answer
Your role is to be the objective analytical voice that bridges the optimism of Sales with the operational realities from Operations. You should not take a side, but rather quantify the financial implications of both viewpoints.
- Model Multiple Scenarios: You would present at least three scenarios from your financial model:
- Base Case: The most likely outcome, perhaps with a minor production delay.
- Upside Case: Assumes sales momentum continues and the supply issues are resolved quickly.
- Downside Case: Models the financial impact of a significant production delay and higher input costs.
- Perform Sensitivity Analysis: For each scenario, you should present a sensitivity analysis showing how Revenue, Gross Margin, and EPS would be impacted by:
- Varying levels of production delay (e.g., 2 weeks, 1 month, 6 weeks).
- Different levels of cost increases from the supplier (e.g., +5%, +10%).
- Recommend a Guidance Range: Based on your analysis, you can provide an objective recommendation for a guidance range that accounts for this uncertainty. For example: "Based on our analysis, we recommend a revenue guidance range of $100M-$105M. The high end reflects the sales pipeline, while the low end incorporates the risk of a four-week production delay." This provides the committee with a data-driven foundation for making their final decision.
Component 4: The External Communication Plan
The final component is the output itself: the carefully worded statement released to the public. This is usually part of the quarterly earnings release and discussed on the subsequent analyst call. This communication must be:
- Clear and Concise: Using plain language to state the guidance range and key assumptions.
- Compliant: Carefully reviewed by legal counsel to ensure it meets all regulatory disclosure requirements (e.g., Regulation Fair Disclosure).
- Consistent: Defining metrics in the same way each quarter to allow for meaningful comparisons.
Conclusion
We've now seen that an "earnings guidance model" is far more than a spreadsheet. It is a strategic process that sits at the intersection of financial analysis, corporate strategy, and legal compliance. As an FP&A analyst, your contribution is providing the rigorous, scenario-based financial analysis that allows senior leadership to confidently communicate with Wall Street.
Key Takeaways:
- Purpose of Guidance: To manage market expectations, reduce stock volatility, and build credibility with investors by providing a forecast of future performance.
- More than a Model: An earnings guidance model is a comprehensive process that includes analytical tools, cross-functional collaboration, and internal controls.
- Core Components: A robust guidance framework is built on four pillars:
- Metrics & Timeframe: Deciding what to guide on (Revenue, EPS, KPIs) and for how long (annual vs. quarterly).
- Assumptions & Sensitivity Analysis: Quantifying the impact of key business drivers and risks.
- A Robust Internal Process: A cross-functional committee that validates assumptions and approves the final numbers.
- A Clear Communication Plan: The carefully crafted external message delivered to the market.
- The FP&A Role: To provide the objective, data-driven analysis that underpins the entire guidance process.
Preview of the Next Module:
This lesson concludes our module on FP&A Processes and Executive Reporting. We have covered the full cycle from internal budgeting and reporting to external communication. Now, we will equip you with the tools to make these processes more efficient, powerful, and insightful. In our next module, "Business Intelligence and Dashboarding for FP&A," we will begin by learning how to connect powerful BI tools like Power BI directly to your Excel models, setting the stage for creating the dynamic dashboards that modern finance teams use every day.