Hello and welcome to the course!
In our previous module, we navigated the complete cycle of FP&A reporting, from internal processes right up to preparing materials for the board and communicating with investors. You learned how to craft a narrative around financial data for senior leadership.
Now, we shift from creating the reports to revolutionizing how they are built, shared, and consumed. Welcome to Module 12: Business Intelligence and Dashboarding for FP&A. In today's data-driven finance world, proficiency in BI tools is no longer a "nice-to-have"—it's a core competency. This module will give you the practical, hands-on skills you need to move beyond static spreadsheets.
Our first step is to tackle the foundational learning outcome: Connect Power BI to Excel models and other data sources. We will cover how to get data out of the Excel models you've learned to build and into Power BI, the industry-leading tool for data visualization and analysis. This is the critical starting point for automating your reporting and creating the dynamic dashboards that business leaders now expect.
1. Getting Started with Power BI
Before we connect to data, we need the right tool. Our primary tool for this module will be Power BI Desktop, a free application from Microsoft that allows you to connect to data, transform it, and build reports locally on your computer.
While your MBA provides the financial theory, and our previous modules provided the Excel modeling practice, Power BI is the vehicle that will bring it all to life in an interactive way.
Power BI Tutorial for Beginners
To begin, let's ensure you have Power BI Desktop installed. This short clip from Kevin Stratvert's 'Power BI Tutorial for Beginners' will guide you through the quick installation process.
Watch the section from 00:13 to 01:01. The video will show you how to find and install Power BI Desktop from the Microsoft Store on Windows.
Once you have Power BI Desktop open, you'll see the main interface. The starting point for any project is Get Data.
2. The Landscape of Data Sources
An FP&A analyst must pull information from various systems. While your financial models will live in Excel, you might also need to connect to accounting systems, sales databases, or other enterprise platforms.
Power BI is exceptionally powerful because it can connect to hundreds of different data sources.

For our purposes, we will focus on the most critical connection for any FP&A professional: Excel. However, the principles you learn here—navigating to a source, selecting data, and loading it—are nearly identical for other data types.
3. Connecting to an Excel Workbook
Let's walk through the most common scenarios you'll encounter when connecting Power BI to your financial models and data files.
Scenario 1: The Local Excel File
This is the most straightforward method. You have an Excel file saved on your computer or a local network drive, and you want to pull its data into Power BI.
How to connect Power BI to Excel
This article from Dynamic Web Training provides a clear, step-by-step guide. We'll start with the first section on connecting to a local file.
Please read section 1, 'How to connect Power BI to an Excel File kept locally/shared drives (On-site/On-Premises)'. Focus on 'Step 1: Importing an On-Premises Excel File into Power BI'. We will discuss the 'Automatic Refresh' part later in this lesson.
After you select your Excel file, Power BI presents you with the Navigator window. This is where you choose exactly what data you want to import.
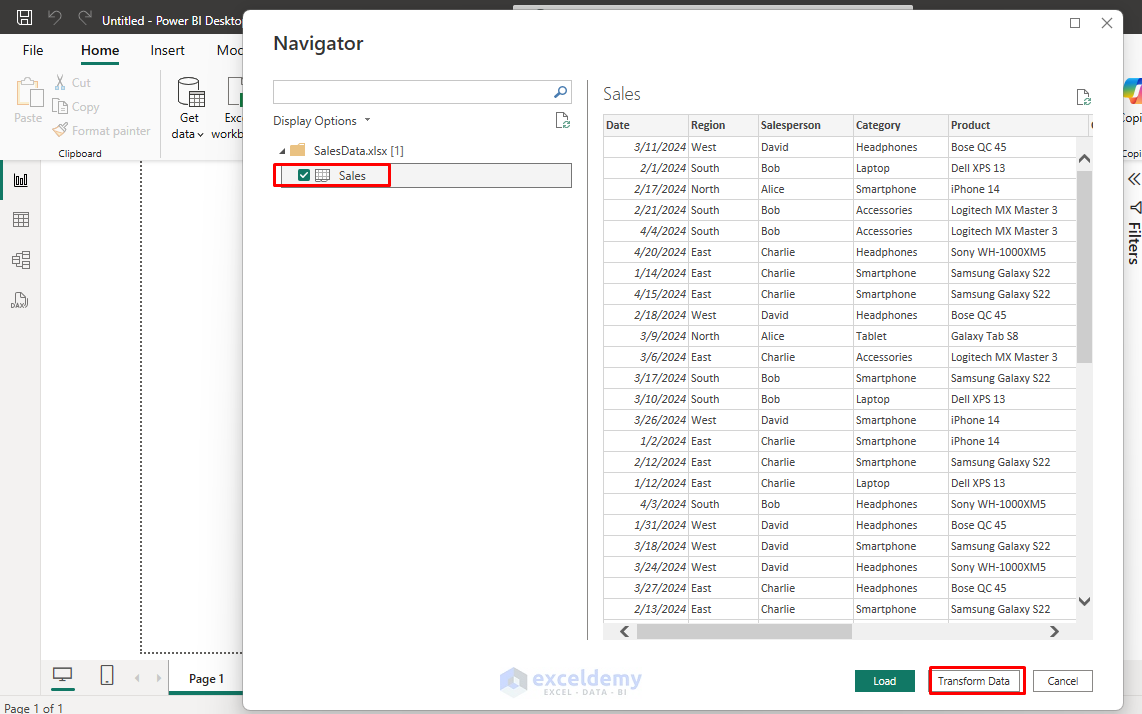
At this stage, you face your first important decision:
- Load: This option brings the selected data directly into your Power BI data model as-is. This is only suitable if your data is perfectly clean and requires no changes.
- Transform Data: This option opens the Power Query Editor. This is a powerful tool within Power BI that allows you to clean, reshape, and prepare your data before it is loaded. In almost all real-world FP&A scenarios, you will choose 'Transform Data'.
Power BI Tutorial for Beginners
Let's see this process in action. This clip from Kevin Stratvert's tutorial demonstrates connecting to an Excel file and shows the Navigator window.
Watch the segment from 01:28 to 02:16. Pay attention to how he selects multiple sheets from the workbook and the 'Load' vs. 'Transform Data' options he points out.
We will dedicate our entire next lesson to the Power Query Editor, but for now, it is essential to know that this "Transform" step is the professional standard for building robust reports.
Scenario 2: The Cloud-Based Excel File (OneDrive or SharePoint)
In a modern corporate environment, files are rarely kept on local machines. They are stored in cloud locations like SharePoint or OneDrive for Business to facilitate collaboration. Connecting Power BI to these sources is not only possible but also highly recommended.
How to connect Power BI to Excel
Let's return to the Dynamic Web Training article to learn how to connect to cloud-based files. This method has a significant advantage over connecting to local files.
Read section 2, 'How to connect Power BI to a Cloud-Based Excel File (OneDrive, SharePoint)'. Note that the connection method is different: you use 'Get Data > Web' and paste a link to the file.
The key takeaway is that connecting to a cloud-based Excel file simplifies data refreshes immensely, a concept we'll explore next. For completeness, note that Power BI can also connect to other cloud sources like Google Sheets using a similar process.
Test your understanding!
You are the FP&A analyst for a multinational company. Your team's annual budget model is a large Excel file stored in a shared SharePoint folder that managers from different regions update. Your CFO has asked you to build a Power BI dashboard that always shows the latest consolidated budget numbers.
Which connection method should you use in Power BI Desktop and why? What is the key advantage of this method regarding data updates?
Show answer
You should use the Get Data > Web connector.
You would navigate to the SharePoint folder, get the file path for the Excel budget model, and paste that into the Web connector in Power BI.
The key advantage is the ability to set up a seamless, scheduled refresh in the Power BI Service (the online version of Power BI). Because the file is in the cloud, Power BI can access it directly to get updates without needing any special on-premise software. This ensures your CFO's dashboard is always synchronized with the latest version of the budget model, without any manual intervention from you.
4. The Critical Concept of Data Refresh
The primary difference between a static Excel report and a Power BI dashboard is the ability to automatically update with new data. This is known as a data refresh. The method you used to connect to your source determines how refreshing works.
Let's look at a summary of the options.
How to connect Power BI to Excel
The article from Dynamic Web Training provides an excellent comparison table and discussion of the different refresh types. Understanding this is key to building sustainable reports.
First, re-read the part of Section 1 about 'Option B: Automatic Refresh Using Power BI Gateway' to understand what's needed for local files. Then, read Section 4, 'How to set up an Automatic Refresh for Cloud-Based Excel Files'. Finally, review the 'Comparison' table at the end of the article. This will consolidate your understanding of the trade-offs.
Here is a summary of the refresh types:
| Connection Type | How it Refreshes | Best For |
|---|---|---|
| Local File | Manual: Click "Refresh" in Power BI Desktop. | Quick, one-off analysis. |
| Local/Network File | Scheduled (Gateway): Requires installing Power BI Gateway software on a machine that is always on. The Gateway acts as a secure bridge between the Power BI cloud service and your on-premise data. | Organizations where data must remain on-premise but automated reports are needed. |
| Cloud File (SharePoint/OneDrive) | Scheduled (Direct): The Power BI service connects directly to the cloud file. No gateway is needed. | Collaborative environments and the most common best practice for modern FP&A teams. |
For your career, focusing on the cloud-based workflow will be most beneficial, as it is the most efficient and scalable solution.
Conclusion
In this lesson, we took the first practical step into the world of business intelligence. You've learned how to bridge the gap between your Excel models and the powerful analytical engine of Power BI.
Key Takeaways:
- Power BI Desktop is your primary authoring tool for creating reports.
- The
Get Datafunction is the universal starting point for connecting to hundreds of sources, with Excel being the most common for FP&A. - When connecting to Excel, you can choose to Load clean data directly or, more commonly, Transform it first using the Power Query Editor.
- Connecting to cloud-based files (SharePoint/OneDrive) is the modern best practice, as it enables seamless, automated data refreshes.
- Refreshing on-premise files automatically requires a Power BI Gateway, which acts as a bridge to the Power BI cloud service.
Preview of the Next Lesson:
We've successfully connected to our data sources, but real-world data is rarely perfect. It often contains errors, inconsistencies, or is simply not in the right format for analysis. In our next lesson, we will dive deep into the Power Query Editor—the tool that opens when you click "Transform Data." You will learn how to clean, transform, and merge data from multiple sources to build a robust and reliable data model, which is the true foundation of any great dashboard.