Hello! Welcome back to our course on Financial Planning and Analysis.
In our previous lesson, you mastered the art of decomposing revenue variance into its price, volume, and mix components. This gave you the ability to explain the story behind your company's top-line performance. Now, we'll apply the same analytical rigor to the other side of the profit and loss statement: costs.
Today's lesson directly addresses the learning outcome: Decompose cost variances into fixed, variable, rate, and efficiency components. Simply telling your management "costs were over budget" is incomplete. A sharp FP&A analyst can pinpoint why. Was it because we paid our workers more than planned? Did production take longer than it should have? Or was it due to a change in our factory's output? This analysis provides the critical link between financial results and operational performance.
1. The Foundation: Standard Costing
Before we can analyze variances, we need to understand what we are comparing against. In most manufacturing and production environments, this "what-if" scenario is the standard cost.
A standard cost is a carefully predetermined cost for producing a single unit of output. It's built from two key elements:
- Standard Price (or Rate): The expected price for one unit of input (e.g., $20 per labor hour, $1.50 per kWh of electricity).
- Standard Quantity: The expected amount of input needed to produce one unit of output (e.g., 6 labor hours per product).
Variance analysis is the process of comparing the actual costs incurred against the standard cost for the actual level of production.
Standard Costing | Variance Analysis | Cost Variances | ACCA | CMA | CPA | Commerce Specialist |
To begin, let's watch a brief introduction from the 'Standard Costing | Variance Analysis' video by Commerce Specialist. This will clarify the core concepts of standards and variances.
Watch from the beginning to 03:43. Focus on understanding the difference between a standard and an actual result, and the meaning of 'favorable' and 'adverse' (or unfavorable) variances.
2. Decomposing Variable Cost Variances
Variable costs, such as direct labor and variable manufacturing overhead (e.g., electricity for machines), change in proportion to production volume. We can break down the total variance for these costs into two primary components: a rate (or price/spending) variance and an efficiency (or usage/quantity) variance.
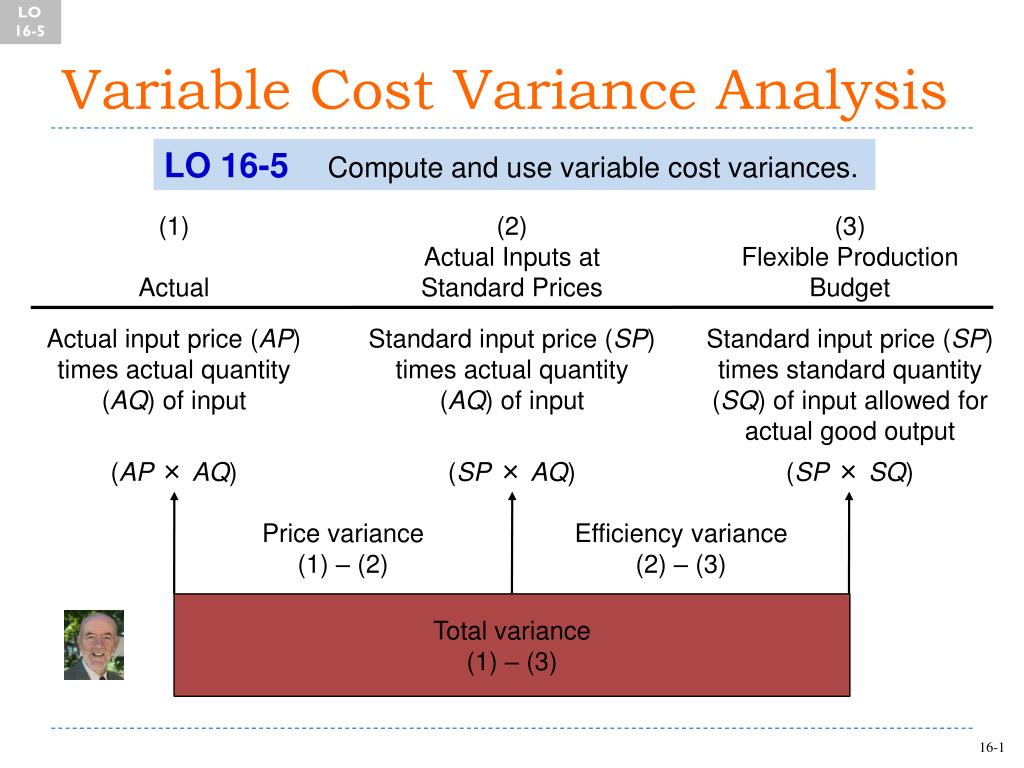
The logic is to isolate one effect at a time:
- Rate/Spending Variance: Did we pay more or less than the standard rate for the inputs we used?
- Efficiency/Usage Variance: Did we use more or less input than the standard allowance for the output we produced?
Let's see how this applies to Direct Labor and Variable Overhead.
2.1. Direct Labor Variance
Direct labor is a classic variable cost. Its total variance is decomposed as follows:
-
Labor Rate Variance: This measures the difference between the standard rate and the actual rate paid to employees, multiplied by the actual hours worked. A common cause for this variance is using higher-paid employees for tasks planned for junior staff, or unexpected overtime payments.
-
Labor Efficiency Variance: This measures the difference between the standard hours that should have been worked for the actual output and the actual hours that were worked. It is a key indicator of worker productivity or operational efficiency.
Notice we use the Standard Rate here to isolate the pure effect of using more or fewer hours, without confounding it with the rate variance.
2.2. Variable Overhead Variance
The analysis for variable overhead is very similar to direct labor, especially when overhead costs are allocated based on labor hours.
-
Variable Overhead Spending Variance: This is analogous to the Labor Rate Variance. It measures the difference between what you expected to spend per activity unit (e.g., per labor hour) and what you actually spent.
-
Variable Overhead Efficiency Variance: This is analogous to the Labor Efficiency Variance. It measures the cost impact of taking more or less time (hours) than the standard allows for the actual production output.
To see these calculations in action, we'll return to the Commerce Specialist video. It provides a clear, worked-out example.
Standard Costing | Variance Analysis | Cost Variances | ACCA | CMA | CPA | Commerce Specialist |
This segment of the video walks through detailed calculations for both labor and variable overhead variances. Pay close attention to how the variable overhead formulas mirror the labor variance formulas.
Watch the video from 11:15 to 27:02. The first part (to 17:04) covers the labor rate and efficiency variances. The second part (from 17:04) covers the variable overhead spending and efficiency variances. Notice how the narrator emphasizes the similarities between the two.
Test your understanding!
A factory has the following standards for a product:
- Standard labor hours per unit: 2 hours
- Standard labor rate: $25/hour
Last month, the factory produced 1,000 units. It used 2,100 hours of labor at an actual total cost of $54,600.
Calculate the Labor Rate and Labor Efficiency variances.
Show answer
First, let's find the inputs:
- Standard Hours for Actual Output: 1,000 units * 2 hours/unit = 2,000 hours
- Actual Hours: 2,100 hours
- Standard Rate: $25/hour
- Actual Rate: $54,600 / 2,100 hours = $26/hour
Now, calculate the variances:
- Labor Rate Variance:
(Standard Rate - Actual Rate) * Actual Hours=($25 - $26) * 2,100=-$1 * 2,100= $2,100 (Unfavorable). The company paid $1/hour more than the standard for the hours worked. - Labor Efficiency Variance:
(Standard Hours - Actual Hours) * Standard Rate=(2,000 - 2,100) * $25=-100 * $25= $2,500 (Unfavorable). The company used 100 more hours than the standard allowed, costing an extra $2,500 at the standard rate.
3. Decomposing Fixed Cost Variances
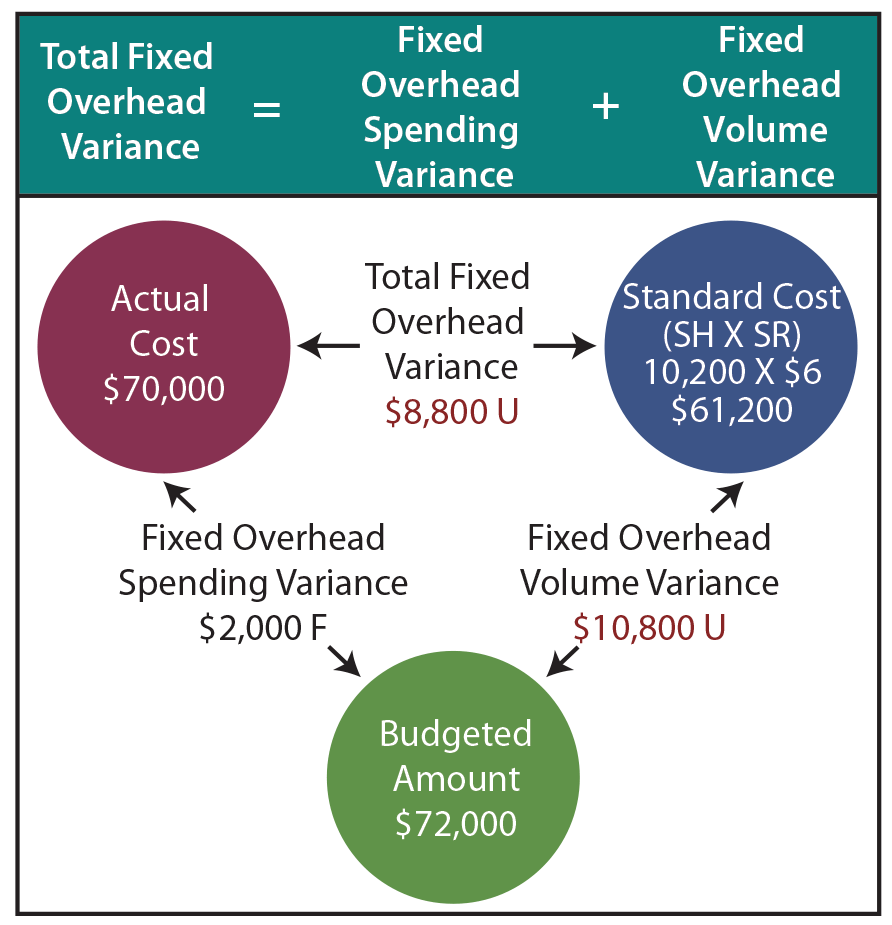
Fixed costs, like factory rent or salaried manager pay, do not change with production volume (within a relevant range). Therefore, their analysis is different. We don't have a true "efficiency" variance in the same way. Instead, we split the total variance into a spending component and a volume component.
-
Fixed Overhead Spending (or Budget) Variance: This is the simplest variance. It's the difference between the budgeted fixed overhead and the actual fixed overhead incurred.
-
Fixed Overhead Volume Variance: This variance is more conceptual. It arises because, for accounting purposes, we "absorb" or "apply" fixed overhead to products at a predetermined rate (e.g., $10 of fixed OH per unit). The volume variance measures the impact of producing more or fewer units than the budgeted volume used to set that rate.
- If you produce more than budgeted, you over-absorb your fixed costs, resulting in a favorable volume variance.
- If you produce less than budgeted, you under-absorb your fixed costs, resulting in an unfavorable volume variance. This signals underutilization of capacity.
Where
Absorbed FOH = Standard Rate per Unit * Actual Units Produced.
3.1. Advanced Decomposition: Fixed Overhead Efficiency and Capacity
For a deeper analysis, particularly valued in senior FP&A roles, the Volume Variance can be broken down further into Efficiency and Capacity variances. This is crucial for understanding why volume differed from the plan.
-
FOH Efficiency Variance: This is identical in calculation to the labor efficiency variance. It asks: for the units we produced, did our team work efficiently? It isolates the productivity of the workforce.
-
FOH Capacity Variance: This variance compares the hours you actually worked to the hours you budgeted to work. It measures how well you utilized your potential production time.
The following video provides an excellent, comprehensive walk-through of the entire fixed overhead variance decomposition, including these more advanced components.
Standard Costing | Variance Analysis | Cost Variances | ACCA | CMA | CPA | Commerce Specialist |
We will now watch the final major section of the Commerce Specialist video, which covers the full decomposition of fixed overhead variances. This is the most complex part of cost variance analysis, so pay close attention to the logic.
Watch from 27:02 to 44:02. Focus on understanding the meaning of 'absorbed' overhead and how the total fixed overhead variance is broken down first into Expenditure (Spending) and Volume, and then how Volume is further split into Efficiency and Capacity.
4. Consolidated View and Reference
To help you organize these concepts, a formal accounting text can provide a structured summary of all the formulas. This aligns with your goal of having access to high-quality reference materials.
The document 'STANDARD COSTING' from the Institute of Chartered Accountants of India serves as an excellent technical reference. We'll use it to see a consolidated diagram and a summary of all the formulas we've discussed.
You don't need to read this entire document now, but I encourage you to skim it and bookmark it for future reference. Specifically, look at: Fig 13.1 (Page 13): A diagram showing the entire cost variance hierarchy. Sections on Labour, Variable Overheads, and Fixed Overheads (Pages 21-33): Skim the formulas to see them in a formal context. 'Important Formulas' Summary (Pages 42-43): This is a fantastic 'cheat sheet' that consolidates all the key variance formulas in one place.
Conclusion
Congratulations! You have now built a comprehensive framework for analyzing the key drivers of cost performance. By moving beyond a simple "actual vs. budget" comparison, you can provide management with actionable insights into pricing, productivity, and capacity utilization.
Key Takeaways:
- Variable Costs (like labor) are decomposed into a Rate Variance (did we pay the right price?) and an Efficiency Variance (did we use the right quantity?).
- Fixed Costs are decomposed into a Spending Variance (did we stick to the budget?) and a Volume Variance (did our production level absorb the budgeted fixed costs?).
- The Fixed Overhead Volume Variance can be further broken down into an Efficiency Variance (how productively did we work?) and a Capacity Variance (how much of our available time did we use?).
- This detailed decomposition allows you to ask targeted questions to operational managers and become a true strategic partner to the business.
In our next lesson, we will focus on communicating these findings. You will learn to perform bridge (waterfall) analysis to visually explain period-over-period changes in key financial metrics. This will allow you to take the variances you've just calculated and present them in a clear, compelling narrative for executive leadership.