Hello! Welcome back to your course on becoming a top-tier FP&A analyst.
In our last lesson, we dove deep into the mechanics of cost variance analysis, learning how to decompose total cost variances into their specific drivers like rate, efficiency, spending, and volume. This skill is critical for diagnosing why financial results differed from the plan. However, raw numbers in a table can be difficult for an executive audience to digest quickly.
This lesson bridges that gap. We will now focus on the art of storytelling with data, addressing the learning outcome: Perform bridge (waterfall) analysis to visually explain period-over-period changes in key financial metrics. A waterfall chart, also known as a bridge, is one of the most powerful tools in an FP&A analyst's arsenal for presenting a clear, intuitive narrative of performance. You'll learn how to take the variances you calculated previously and build a compelling visual story that explains how you got from a budgeted number to an actual result.
1. What is a Waterfall Chart?
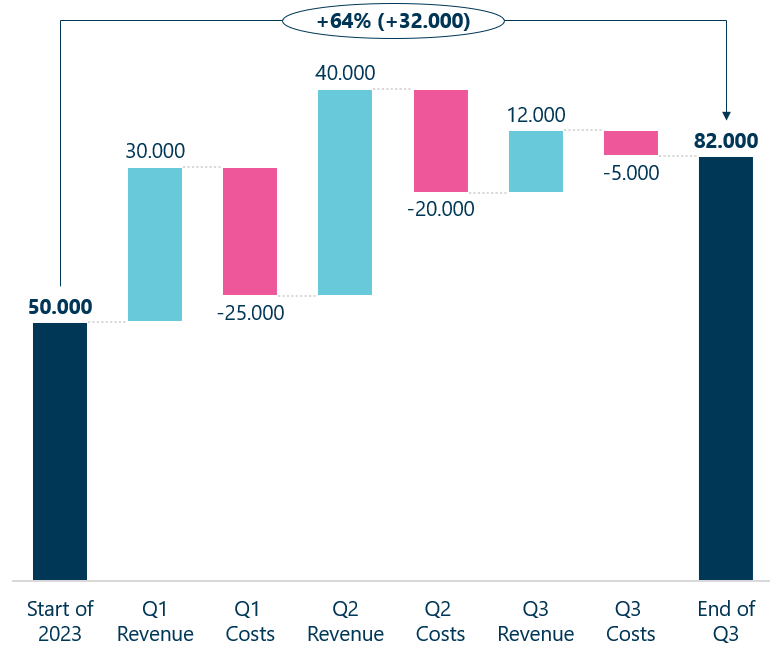
A waterfall chart is a data visualization that shows how an initial value is increased or decreased by a series of intermediate changes, resulting in a final value. Imagine walking from a starting point (e.g., last year's profit) to an ending point (this year's profit). The waterfall chart shows each step you took along the way—some steps moving you forward (like revenue growth) and some moving you backward (like increased costs).
These charts are indispensable in finance for tasks such as:
- Explaining changes in Net Income, EBITDA, or other key metrics from one period to another.
- Visualizing the components of a company's revenue or cost structure.
- Showing the journey from a budgeted figure to the actual result, using variances as the connecting "bridge".

To get a formal understanding of what these charts are and where they are used, let's look at a couple of quick introductions.
How to Create a Waterfall Chart in Excel
The article 'How to Create a Waterfall Chart in Excel' from Macabacus, a popular tool for finance professionals, provides a concise introduction to the concept and its applications.
Read the section 'Understanding Waterfall Charts' to solidify your understanding of their purpose and common uses in finance.
Excel Waterfall Charts: The Easiest Way
Similarly, the article 'Excel Waterfall Charts: The Easiest Way' from Zebra BI offers a great summary and makes an important distinction between a general 'waterfall' and a 'bridge' chart.
Read the section 'Waterfall charts 101'. Pay attention to the distinction made between a bridge chart (which includes subtotals) and a standard waterfall chart.
2. Building an EBITDA Bridge in Excel
Now for the practical application. Let's build a common and highly valuable visual: an EBITDA bridge. This chart explains the change in EBITDA from one year to the next. This is precisely the kind of analysis you would prepare for a monthly or quarterly business review.
We'll use Excel's built-in waterfall chart functionality, which became available in Excel 2016.
The general process is:
- Prepare your data: Structure your data with a starting value (e.g., Prior Year EBITDA), a series of positive and negative changes (the drivers), and an ending value (Current Year EBITDA).
- Insert the chart: Select your data and insert a Waterfall chart.
- Set totals: This is the most critical step. You must manually tell Excel which bars are start/end points. These bars will then start from the horizontal axis, while the change bars will "float."
- Format and declutter: Adjust colors, remove gridlines, and refine labels to make the chart clear and professional.
What is EBITDA? || EBITDA Bridge || Waterfall Chart in Excel || Financial Performance
The following video from YouExcel Tutorials provides a perfect, straightforward walkthrough of creating an EBITDA bridge.
Watch from 03:00 to 06:10. Follow the steps for preparing the data, inserting the chart, and, most importantly, setting the 'Prior Year EBITDA' and 'Current Year EBITDA' columns as totals.
Test your understanding!
In the video you just watched, why did the "Prior Year EBITDA" and "Current Year EBITDA" bars drop to the baseline after being "Set as Total"? What would the chart look like if this step were skipped?
Show answer
Setting a data point as a "Total" tells Excel that it is a starting point, an ending point, or a subtotal, not an incremental change. This action anchors the bar to the horizontal axis. If this step were skipped, both the starting and ending EBITDA values would be treated as incremental changes. The "Prior Year EBITDA" bar would rise from zero, and the "Current Year EBITDA" bar would float, starting from the top of the previous bar, which would make the chart nonsensical.
3. Creating Professional, "Investment-Bank Quality" Visuals
Creating a basic waterfall chart is one thing; creating one that looks like it came from a Goldman Sachs research report is another. Polishing your visuals is a key differentiator for top FP&A analysts. This involves custom formatting, careful color selection, and attention to detail.
Make Goldman Sachs Visuals in Excel!
The 'Make Goldman Sachs Visuals in Excel!' video from Kenji Explains demonstrates several advanced formatting techniques to elevate a standard waterfall chart.
Watch this video from 00:00 to 05:29. You don't need to replicate every single step right now, but focus on the techniques used: Applying custom number formats to add '+' signs and units (like 'PP' for percentage points). Adjusting bar colors and transparency. Removing connector lines for a cleaner look. Adding vertical lines using shapes to demarcate sections.
These techniques for refinement are what separate a standard report from a high-impact executive presentation.
4. Best Practices for Effective Waterfall Charts
A tool is only as good as the person using it. To ensure your waterfall charts are insightful and not misleading, it's crucial to follow established best practices.
Let's review a comprehensive guide on what to do—and what to avoid.
Excel Waterfall Charts: The Easiest Way
The Zebra BI article we viewed earlier contains an excellent list of best practices. This will help you critique your own work and create truly effective visualizations.
Read the section 'Bonus: 10 best practices for impactful waterfall charts'. Pay special attention to these key points: Remember to set the totals (#1): We've seen this, but it's the most common error. Ditch the clutter (#2): Remove unnecessary gridlines, legends, and axes to focus the viewer's attention. Break the axis to highlight contributions (#3): Understand this technique for when changes are small relative to totals, but also be aware of its potential to mislead. Add (some) subtotals (#7): This is how you create a true 'bridge' chart, showing intermediate steps like Gross Profit on the way to Net Income.
Applying these principles will ensure your analysis is not only visually appealing but also analytically sound and easy to interpret.
Conclusion
In this lesson, you've added a powerful data storytelling technique to your FP&A toolkit. You've learned not just how to create a waterfall chart in Excel, but how to do so in a way that provides clear, actionable insights for decision-makers. This skill is fundamental for translating complex financial data into a compelling narrative.
Key Takeaways:
- Waterfall (or bridge) charts are essential for visualizing how a starting value changes to an ending value through a series of positive and negative contributions.
- The key steps in Excel are data preparation, chart insertion, and setting start/end points as totals.
- Professional quality comes from thoughtful formatting: decluttering the chart, using intentional colors, and applying custom labels.
- Following best practices, such as using subtotals and ensuring clarity, elevates your analysis from simple reporting to strategic communication.
In our next lesson, we will broaden our analytical perspective. Having just focused on explaining changes in performance, we will now shift to assessing the overall state of a company's financial health. We will begin the module on "Financial Performance and Profitability Analysis" by learning how to calculate and interpret liquidity, profitability, leverage, and efficiency ratios to assess company performance.