Hello! Welcome to the first lesson of our second module, "Foundations of Accounting for Modelers."
In the previous module, you built a powerful Excel toolkit, culminating in the use of dynamic arrays to create efficient and flexible reports. We've focused on mastering the tool. Now, we pivot to mastering the substance. This module lays the accounting groundwork that is essential for any aspiring FP&A analyst. Without a deep, practical understanding of these principles, a financial model is just a spreadsheet.
This lesson addresses a cornerstone concept and a classic finance interview question. Our learning outcome is to: Explain how the three core financial statements (the Income Statement, Balance Sheet, and Cash Flow Statement) are interconnected.
By the end of this lesson, you will be able to trace how a single business transaction ripples through all three statements, understand the key accounts that link them, and articulate these connections clearly and professionally.
1. The Three Statements: A High-Level Overview
Before diving into the details, let's establish the role of each statement and see a visual map of how they connect.
- The Income Statement (IS): Reports a company's financial performance over a specific period (e.g., a quarter or a year). It starts with revenue and subtracts costs and expenses to arrive at the "bottom line": Net Income. It answers the question: Was the company profitable?
- The Balance Sheet (BS): Provides a snapshot of a company's financial position at a single point in time. It follows the fundamental accounting equation: Assets = Liabilities + Shareholders' Equity. It answers the question: What does the company own, and what does it owe?
- The Cash Flow Statement (CFS): Shows how cash moved in and out of the company over the same period as the Income Statement. It reconciles the accrual-based Net Income to the actual change in cash. It answers the question: Where did the cash come from, and where did it go?
These three statements are not independent; they are intrinsically linked.

This image is our roadmap. Let's now explore each of those connecting paths in detail.
2. The Core Linkages: A Step-by-Step Explanation
To guide our exploration, we'll use an excellent article from Wall Street Prep, a top training provider for finance professionals. The article is framed around answering this exact question in a high-stakes interview, which directly aligns with your career goals.
First, let's get familiar with the formal definitions and the structure of the article.
How are the Three Financial Statements Linked?
This article provides a comprehensive overview of how the three financial statements are conceptually connected. We will use it as our primary guide for this lesson.
Read the introduction ('How are the Three Financial Statements Linked?') and review the table that provides a description of the Income Statement, Balance Sheet, and Cash Flow Statement. This will set the stage for the more detailed analysis to follow.
Now that you have the basic definitions, let's trace the specific connections. The flow of information is logical and always follows the same path in a well-structured model.
Link 1: Income Statement → Cash Flow Statement
The connection starts here. The bottom line of the Income Statement, Net Income, is the top line of the Cash Flow Statement (under the indirect method, which is almost always used in financial modeling).
However, Net Income is an accrual measure of profit, not a cash measure. To get from profit to actual cash flow, we must adjust for two main categories:
- Non-Cash Expenses: Expenses that were recorded on the Income Statement but didn't involve an actual cash outlay. The most common example is Depreciation & Amortization (D&A). We add D&A back to Net Income.
- Changes in Net Working Capital (NWC): These are changes in the short-term operational assets and liabilities, like Accounts Receivable, Inventory, and Accounts Payable. For example, an increase in Accounts Receivable means you sold something but haven't collected the cash yet, so it's a use of cash that reduces your cash flow relative to Net Income.
Link 2: Income Statement → Balance Sheet
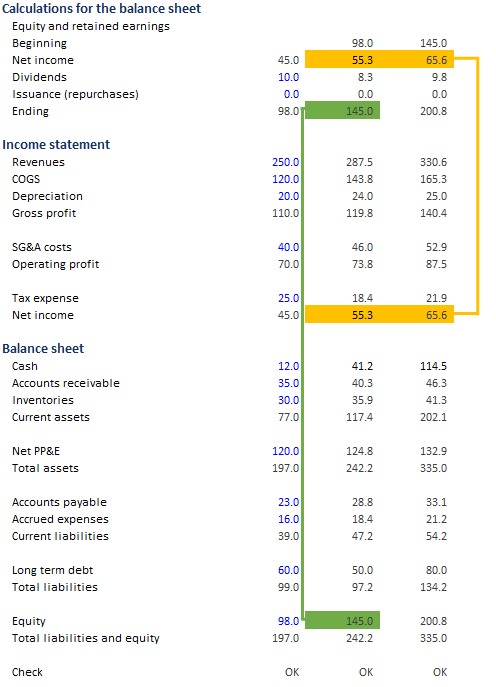
The primary link here is through Retained Earnings, which is part of Shareholders' Equity on the Balance Sheet. The formula is simple but powerful:
This equation shows how a company's cumulative profits (Net Income) flow onto the Balance Sheet, increasing the company's net worth (Equity). This is how the performance over a period (IS) updates the financial position at the end of that period (BS).
Link 3: Cash Flow Statement → Balance Sheet
This is where everything comes together.
- Ending Cash: The bottom line of the Cash Flow Statement is the Net Change in Cash. You add this to the Beginning Cash balance (which was the Ending Cash balance from the prior period's Balance Sheet) to get the Ending Cash for the current period. This Ending Cash figure is the number that appears in the "Cash and Cash Equivalents" line item on the current Balance Sheet.
- Working Capital: The changes in NWC accounts on the CFS are calculated from the beginning and ending balances of those accounts (e.g., Accounts Receivable, Inventory, Accounts Payable) on the Balance Sheet.
- PP&E: Capital Expenditures (CapEx), a major cash outflow in the Cash from Investing section, increases the Property, Plant, & Equipment (PP&E) account on the Balance Sheet.
- Debt and Equity: Any debt raised or paid down, or equity issued or bought back (all captured in the Cash from Financing section), directly impacts the corresponding Debt and Equity accounts on the Balance Sheet.
Let's return to the Wall Street Prep article to see these connections explained in detail.
How are the Three Financial Statements Linked?
The article breaks down each of these links methodically. As you read, focus on the specific line items that act as the 'bridges' between the statements.
Read the following sections: 'How are the Income Statement and Cash Flow Statements Linked?' 'How are the Cash Flow Statement and Balance Sheet Linked?' 'How are the Income Statement and Balance Sheet Linked?' The Excel walkthrough sections from 'Reconcile Net Income...' to 'Retained Earnings and Ending Cash Balance'. For the Excel walkthrough, you don't need to build the model yourself right now. Focus on understanding the narrative of how the numbers flow from one statement to the next, especially the roll-forward formulas for PP&E and Retained Earnings.
Test your understanding!
A company purchases a new machine for $50,000 using cash. In the first year, the machine is depreciated by $5,000. For simplicity, assume no other transactions. At a high level, how does the purchase and first-year depreciation affect the three statements?
Show answer
- Income Statement: The depreciation of $5,000 is an expense. Assuming a 20% tax rate, this reduces Pre-Tax Income by $5,000, Tax by $1,000, and Net Income by $4,000.
- Cash Flow Statement:
- Starts with Net Income, which is down by $4,000.
- The $5,000 depreciation is a non-cash expense, so it's added back.
- The purchase of the machine is a $50,000 cash outflow under Cash from Investing (CapEx).
- The net change in cash is (-$4,000 + $5,000 - $50,000) = -$49,000.
- Balance Sheet:
- Assets: Cash is down by $49,000. PP&E is up by $45,000 (a $50,000 increase from the purchase, less $5,000 in accumulated depreciation). Total assets are down by $4,000.
- Liabilities & Equity: Retained Earnings is down by $4,000 (due to the drop in Net Income). Total Liabilities & Equity are down by $4,000.
- The Balance Sheet remains in balance (Assets decreased by $4,000, and L+E decreased by $4,000).
3. The Modeler's Perspective: Process and Flow
Understanding the conceptual links is one thing; seeing how they work in the process of building a model is another. In practice, you build the statements sequentially, relying on the outputs of one to create the inputs for another.
The following resource provides a visual representation of this workflow.
Building a 3 Statement Financial Model in Excel
This presentation from the University of Notre Dame's Corporate Finance Club illustrates the practical steps and the flow of information when building a 3-statement model.
Review the following slides: 'Financial forecasting framework': Notice how the IS, BS, and CFS are central, but fed by 'Assumptions & drivers' and 'Supporting schedules'. 'Financial modeling steps': This shows the typical build order. Note that the CFS is often one of the last pieces constructed because it depends on outputs from the other statements. The set of slides from 'Complete Cash Flow Statement' to 'Cash flows from financing activities': These slides explicitly show how each section of the CFS is derived from items on the IS and changes on the BS.
The final, crucial step in any model is the "balance check" – a formula that simply subtracts Total Liabilities & Equity from Total Assets. If all your links are correct, this check will equal zero. If not, it means a link is broken somewhere, and the troubleshooting begins. This is why a deep understanding of these interconnections is so critical for a modeler.
Conclusion
You've now covered one of the most fundamental concepts in finance and modeling. Mastering these connections separates a spreadsheet user from a true financial analyst.
Key Takeaways:
- The three financial statements are an integrated system, not standalone reports.
- Net Income is the primary link, flowing from the IS to the top of the CFS and, via Retained Earnings, to the BS.
- The CFS reconciles accrual-based Net Income to cash by adjusting for non-cash items (like D&A) and changes in Working Capital.
- The Ending Cash balance on the CFS provides the cash figure for the BS, closing the loop.
- Supporting schedules for items like PP&E and Debt are crucial, as they impact all three statements (e.g., CapEx on CFS, PP&E asset on BS, Depreciation on IS).
In this lesson, we noted the important difference between accrual profit (Net Income) and cash flow. This difference is governed by the principles of accrual accounting. In our next lesson, we will dive deeper into these principles, focusing on how revenue and expenses are recognized and how that impacts a financial model. This will provide the "why" behind many of the adjustments we discussed today.