Hello! Welcome to the final lesson in our module on Financial Performance and Profitability Analysis.
In our previous lessons, we've focused on calculating and interpreting powerful, but purely financial, metrics like Adjusted EBITDA and Return on Invested Capital (ROIC). These numbers tell a crucial part of the story—profitability and capital efficiency—but they are inherently backward-looking and don't capture the full picture of what drives long-term value.
Today, we will broaden our lens to encompass a more holistic and strategic view of performance. We will address the learning outcome: Introduce the balanced scorecard framework and select appropriate KPIs for holistic performance management. The Balanced Scorecard (BSC) is a seminal strategic management framework that complements financial measures with the non-financial drivers of future success. For an aspiring FP&A leader, understanding how to use this framework is key to moving beyond reporting the past to actively shaping the future.
1. The Need for a "Balanced" View
Traditional financial reporting was designed for the industrial era, where tangible assets like factories and equipment were the primary sources of value. In today's knowledge-based economy, much of a company's value lies in its intangible assets: customer relationships, employee skills, innovative processes, and culture. The problem? Standard financial statements do a poor job of measuring these critical assets.
To understand this challenge directly from one of the creators of the Balanced Scorecard, let's hear from Professor Robert S. Kaplan.
CPA R Kaplan Explains the Balanced Scorecard
In this video, 'CPA R Kaplan Explains the Balanced Scorecard', Professor Robert S. Kaplan discusses why traditional financial reports are insufficient for managing modern companies and how this motivated the development of the BSC.
Please watch from the beginning to 2:58. Focus on Kaplan's distinction between tangible and intangible assets and his core belief: 'If you don't measure something, you can't manage it.'
As Kaplan explains, relying solely on financial metrics is like trying to fly a modern jet with only an airspeed indicator. You might know your current speed, but you have no information on your altitude, fuel, or direction. This is the origin of the famous "airplane cockpit" analogy for the Balanced Scorecard.
To get a quick but comprehensive view of the business, managers need a balanced set of dials and indicators. For a foundational perspective on this, please review the introduction of the original 1992 Harvard Business Review article that introduced this concept to the world.
The Balanced Scorecard – Measures that Drive Performance
This is the article that started it all. Reading the introduction will give you the original context and the powerful cockpit analogy.
Read the first two pages of the article (pages 71-72), up to the section titled 'Customer Perspective'. Focus on how the authors frame the problem and introduce the four key questions the scorecard answers.
2. The Four Perspectives of the Balanced Scorecard
The BSC framework organizes performance measures into four critical perspectives, ensuring a balance between short-term financial results and the long-term drivers of value.

Let's explore each of these perspectives.
Balanced Scorecard (With A Step-by-Step Example) | From A Business Professor
The video 'Balanced Scorecard (With A Step-by-Step Example)' provides a clear and concise explanation of each of the four perspectives, complete with example metrics.
Watch the section from 1:09 to 2:40, which details the Financial, Customer, Internal Processes, and Learning & Growth perspectives. Take note of the types of metrics that fall under each category.
Here's a summary of the core question each perspective seeks to answer:
-
The Financial Perspective ("How do we look to shareholders?"): This is the traditional focus of corporate performance. It includes metrics like ROIC, revenue growth, profitability, and cash flow. Ultimately, success in the other perspectives should translate into improved financial performance.
-
The Customer Perspective ("How do customers see us?"): This perspective focuses on the target customers and market segments. It measures the company's performance through the eyes of its customers, using metrics like customer satisfaction, retention, market share, and brand perception.
-
The Internal Process Perspective ("What must we excel at?"): To satisfy customers and shareholders, what internal processes are most critical? This perspective identifies the key operational and business processes that the company must master. Metrics might include cycle time, quality control, asset utilization, and process efficiency.
-
The Learning and Growth Perspective ("How can we continue to improve and create value?"): This perspective focuses on the intangible assets that provide the foundation for all future success. It centers on the organization's ability to innovate, learn, and improve. Key metrics often relate to employee capabilities (e.g., training hours, employee satisfaction), information systems, and organizational culture and alignment.
3. From Strategy to KPIs: A Practical Approach
The power of the Balanced Scorecard is not just in having a list of metrics in four boxes. Its real value lies in using it to translate high-level strategy into a coherent set of actionable and measurable objectives.
A common mistake is to simply collect existing KPIs and sort them into the four perspectives. A far more effective approach starts with strategy. For a deeper, academic view on this, we'll turn to a more advanced paper by Professor Kaplan. Given your MBA studies, you'll appreciate the rigor behind this concept.
Conceptual Foundations of the Balanced Scorecard
In his paper 'Conceptual Foundations of the Balanced Scorecard', Kaplan explains that creating a BSC should not start with selecting metrics, but with defining strategic objectives within each perspective.
Read the section titled '2. Strategic Objectives' (pages 18-21). Focus on the critical shift from 'picking metrics' to 'describing what we want to achieve with our strategy'. Notice the examples of how strategic objectives are phrased.
This leads to a clear, five-step process for developing a meaningful Balanced Scorecard:
- Develop a Vision: What does the company aspire to be?
- Determine Strategic Objectives: Based on the vision, what are the most important goals within each of the four perspectives?
- Analyze Critical Success Factors: What specific actions or factors will be crucial for achieving those objectives?
- Choose Key Performance Indicators (KPIs): Select specific, measurable metrics that track progress against your strategic objectives.
- Set Targets, Plans, and Initiatives: For each KPI, set a target, define a plan to achieve it, and fund the necessary initiatives.
The "Business School 101" video walks through a great example of this process in action.
Balanced Scorecard (With A Step-by-Step Example) | From A Business Professor
Let's return to the 'Balanced Scorecard (With A Step-by-Step Example)' video to see how this five-step process is applied to build a complete scorecard for a hypothetical company.
Watch from 2:40 to 6:26. Observe how the company's vision leads to specific objectives, measures (KPIs), targets, and initiatives across the four perspectives.
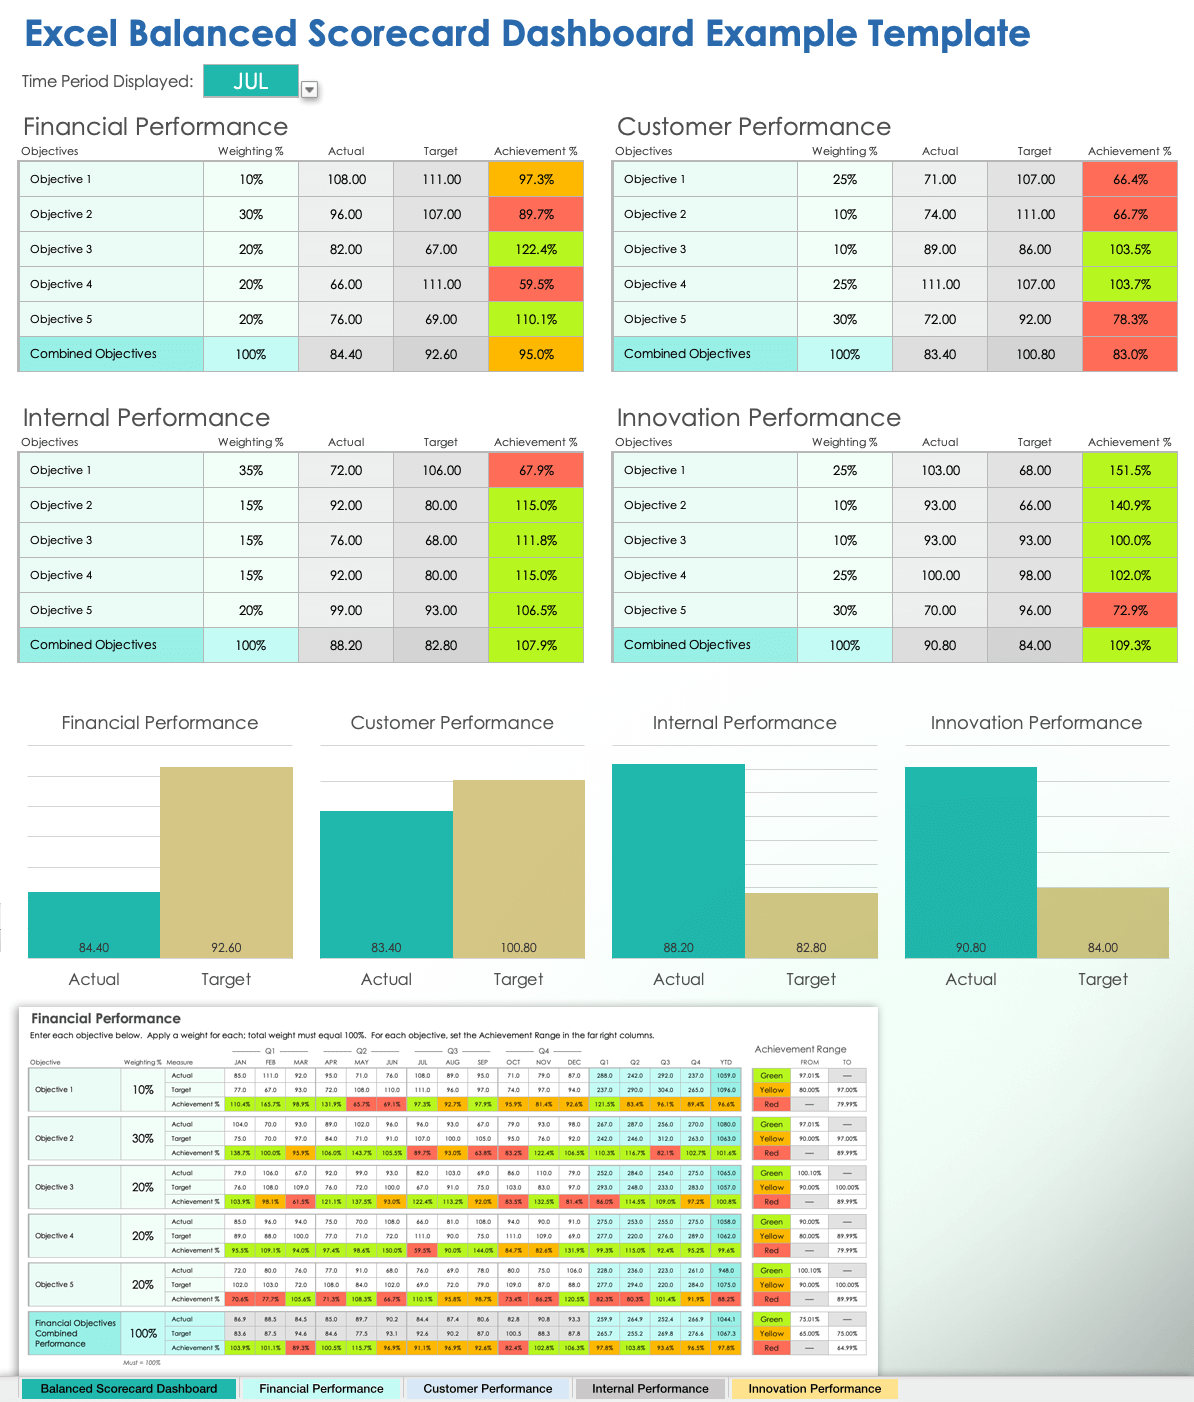
The final output often looks something like this dashboard, which translates the strategic framework into a practical performance management tool in Excel.
4. Strategy Maps: Visualizing Cause-and-Effect
Your engineering background provides a great foundation for understanding the next logical step in the BSC framework: Strategy Maps.
A strategy map is a visual representation that connects the strategic objectives in a cause-and-effect chain across the four perspectives. It tells the story of your strategy, showing how investments in learning and growth lead to improvements in internal processes, which in turn drive customer satisfaction and, ultimately, financial results.
This is Figure 2 from Kaplan's 'Conceptual Foundations' paper. It's a generic strategy map illustrating the causal flow from Learning & Growth at the bottom up to the Financial Perspective at the top.
For example, a strategy map might show that:
- Investing in employee training on a new technology (Learning & Growth)
- Leads to a more efficient product development process (Internal Process)
- Which results in faster time-to-market for new products (Customer)
- And ultimately drives higher revenue and market share (Financial).
This causal logic is the heart of holistic performance management. It makes the connections between different parts of the business explicit and testable.
Test your understanding!
Imagine you are an FP&A analyst for a luxury automaker. The company's primary strategic goal for the next three years is to be recognized as the undisputed leader in innovative in-car technology and customer experience.
For each of the four BSC perspectives, propose one strategic objective and one corresponding KPI that directly support this strategy.
Show answer
Here is one possible set of answers. Many others could be correct, as long as they align with the strategy.
-
Financial Perspective:
- Objective: Increase profitability from high-margin technology options.
- KPI: Percentage of new vehicle sales that include the premium technology package.
-
Customer Perspective:
- Objective: "Delight customers with a seamless and intuitive technology experience."
- KPI: Customer satisfaction score (CSAT) specifically related to the in-car infotainment and driver-assist systems.
-
Internal Process Perspective:
- Objective: Excel at integrating cutting-edge software into our vehicles.
- KPI: Average time from software feature conception to over-the-air deployment in customer vehicles.
-
Learning & Growth Perspective:
- Objective: Develop and retain world-class software engineering talent.
- KPI: Attrition rate (%) of employees in the R&D and software engineering departments.
Conclusion
Today, we've moved beyond purely financial analysis to a strategic management system. The Balanced Scorecard provides a robust framework for ensuring that a company is not only performing well today but is also building the capabilities required for future success.
Key Takeaways:
- The Balanced Scorecard complements backward-looking financial measures with non-financial drivers of future value.
- It organizes performance into four key perspectives: Financial, Customer, Internal Process, and Learning & Growth.
- The correct way to build a BSC is to start with strategy, then define objectives for each perspective, and only then select aligned KPIs and set targets.
- Strategy Maps visualize the cause-and-effect relationships between objectives, telling the story of how the company creates value.
- This framework allows FP&A professionals to facilitate strategic conversations and ensure that resources are allocated to initiatives that truly drive the business forward.
This lesson concludes our module on Financial Performance and Profitability Analysis. We've covered everything from calculating core profitability with Adjusted EBITDA, to measuring capital efficiency with ROIC, and now to building a holistic strategic management framework with the Balanced Scorecard.
In our next module, we will begin one of the most important topics in finance: Discounted Cash Flow (DCF) Valuation. The strategic thinking and focus on long-term value drivers we've discussed today will serve as a perfect foundation for forecasting the future cash flows that are at the heart of any valuation model.