Hello! Welcome to the next lesson in our module on "Financial Performance and Profitability Analysis."
In our last session, we delved into Adjusted EBITDA, a metric designed to reveal a company's core operating profitability by stripping out non-recurring and non-cash items. While this gave us a powerful lens on profit generation, it doesn't tell the whole story. A company can be highly profitable but also highly inefficient in how it uses its money to generate those profits.
Today, we shift our focus from "how much profit?" to "how well is capital being used to create that profit?" This brings us to a cornerstone metric of financial analysis: Return on Invested Capital (ROIC). This lesson directly addresses the learning outcome: Model and interpret Return on Invested Capital (ROIC) to assess a company's capital efficiency.
Understanding ROIC is crucial for any FP&A analyst, especially those with ambitions for strategic and high-level roles. It connects the income statement and balance sheet to answer the ultimate question: is the business creating or destroying value?
1. What is Return on Invested Capital (ROIC)?
ROIC is a ratio that measures how well a company is generating profits from its total pool of capital, which includes both debt and equity. It essentially quantifies the return generated for every dollar invested in the business.
The core formula is:
A high ROIC suggests that a company has a strong competitive advantage and is efficient at deploying capital. A low or declining ROIC can signal intensifying competition, poor management decisions, or a maturing industry.
To get a clear overview of ROIC and its place among other key return metrics, let's start with a short video.
Key Financial Metrics and Ratios: ROA, ROE, and ROIC
This video from Mergers & Inquisitions / Breaking Into Wall Street introduces the concept of financial ratios and provides a concise definition of ROIC, explaining its components and what it tells you about a company's capital efficiency.
Please watch the video from 5:56 to 8:20 and from 10:01 to 10:54. Focus on: The definitions of NOPAT and Invested Capital. The reason for using operating income (a pre-debt metric) in the numerator. The core meaning of the final ROIC percentage.
2. Deconstructing the ROIC Formula
To model ROIC accurately, we need to understand each component in detail. This is where the true analytical rigor lies. For a deep, foundational understanding, we will refer to a paper by Professor Aswath Damodaran of NYU's Stern School of Business, a leading authority in corporate finance and valuation.
a) Numerator: Net Operating Profit After Tax (NOPAT)
NOPAT represents the hypothetical after-tax operating profit a company would have if it had no debt.
Let's break down why we use these specific components.
ROC, ROIC and ROE: Measurement and Implications
The paper 'ROC, ROIC and ROE: Measurement and Implications' by Professor Damodaran explains the theoretical justification for the NOPAT calculation. This reading will solidify why we construct the numerator this way.
Read the section titled 'I. After-tax Operating Income' on pages 7 and 8. It starts right after the headline 'Accounting Returns'. Focus on understanding why operating income (EBIT) is the correct starting point and why a hypothetical tax rate is applied, rather than using actual taxes paid.
Key Points on NOPAT:
- Operating Income (EBIT): We use EBIT because it's a pre-interest measure of profit. Since Invested Capital (the denominator) includes both debt and equity, the profit figure in the numerator must be the profit available to all capital providers. Net Income is after interest has been paid to debt holders, so it's only available to equity holders and would be an incorrect numerator.
- Tax Adjustment: We apply a tax rate to EBIT to make it an after-tax figure. We don't simply use Earnings Before Tax (EBT) and subtract the actual taxes paid. This is because actual taxes are lower due to the tax-deductibility of interest expense (the "debt tax shield"). This tax benefit of debt is already accounted for in the Weighted Average Cost of Capital (WACC), which we'll discuss later. Using an "unleashed" tax on EBIT prevents us from double-counting this benefit.
b) Denominator: Invested Capital
Invested Capital represents the total amount of money raised from debt and equity holders that has been put to work in the company's operating assets.
There are two primary ways to calculate it:
- Financing Approach (from the Balance Sheet's right side):
\text{Invested Capital} = \text{Book Value of Debt} + \text{Book Value of Equity} - \text{Cash & Cash Equivalents}
Other non-operating assets should also be subtracted if material. - Operating Approach (from the Balance Sheet's left side):
\text{Invested Capital} = \text{Net Working Capital} + \text{Net Property, Plant & Equipment}
Net Working Capital here is defined as (Current Operating Assets - Current Operating Liabilities).
Why do we make these specific choices?
ROC, ROIC and ROE: Measurement and Implications
Let's return to Professor Damodaran's paper to understand the logic behind the Invested Capital calculation.
Read the section titled 'II. Invested Capital' on pages 8-10. Pay close attention to the reasoning for using book value instead of market value and for netting out cash.
Key Points on Invested Capital:
- Book Value vs. Market Value: We are assessing the return on the capital that was historically invested in the business. Book value represents this historical investment. Market value, in contrast, reflects the market's current expectation of future performance and already impounds the value created, which would lead to circular reasoning.
- Subtracting Cash: Operating Income (EBIT) does not include the interest income earned on cash balances. To maintain consistency between the numerator and denominator, we remove non-operating assets like cash from the capital base.
- Averaging: Because NOPAT is measured over a period (e.g., a year) while Invested Capital is a snapshot at a point in time, it's best practice to use the average of the beginning and ending invested capital for the period. This better reflects the capital base that was available throughout the year to generate the NOPAT.
3. A Step-by-Step Calculation
Now let's walk through a complete, real-world calculation. The following animated video provides an excellent, clear example using Microsoft's financial statements.
Animated: How to Calculate ROIC With a Real-Life Example (Microsoft $MSFT)
This video, 'Animated: How to Calculate ROIC', will guide you through the entire process, from pulling numbers from the financial statements to the final calculation. It brings together the concepts of NOPAT and Invested Capital in a practical way.
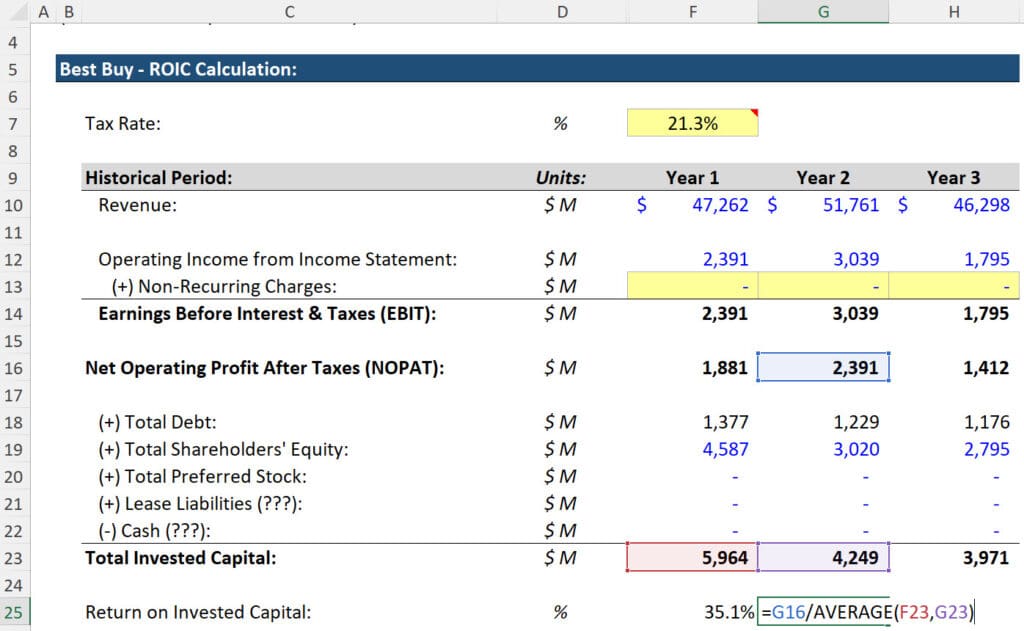
Watch the video from the beginning to 6:36. Follow along as the presenter: Identifies EBIT and calculates the effective tax rate to find NOPAT. Calculates Invested Capital for two consecutive years by summing debt and equity and subtracting cash. Computes the average Invested Capital. Divides NOPAT by the average Invested Capital to arrive at the final ROIC.
Here is a static example of what this calculation looks like in an Excel model.
4. How to Interpret and Use ROIC
Calculating the number is only half the battle. The real value comes from interpreting it correctly.
The Golden Rule: ROIC vs. WACC
The most fundamental way to interpret ROIC is to compare it to the company's Weighted Average Cost of Capital (WACC). WACC represents the blended cost of the capital a company has raised.
- If ROIC > WACC, the company is generating returns in excess of its cost of capital. It is creating value.
- If ROIC < WACC, the returns are not sufficient to cover the cost of capital. The company is destroying value.
Animated: How to Calculate ROIC With a Real-Life Example (Microsoft $MSFT)
Let's return to the animated video, which does an excellent job of explaining this crucial comparison.
Watch the final segment from 6:36 to 9:00. Focus on the concept of comparing ROIC to WACC to determine if a company is creating value, and how to use ROIC for trend and industry analysis.
Trend and Peer Analysis
Beyond the WACC comparison, ROIC is incredibly useful for:
- Trend Analysis: Tracking a company's ROIC over several years can reveal trends in its competitive position and operational efficiency.
- Peer Analysis: Comparing a company's ROIC to its direct competitors helps assess its relative performance. However, context is key.
Key Financial Metrics and Ratios: ROA, ROE, and ROIC
The first video we watched provides a powerful case study comparing the ROIC of Walmart, Amazon, and Salesforce. This highlights the importance of context when using this metric.
Please watch the segment from 15:16 to 24:07. Note how companies with very different business models and growth profiles (like mature Walmart vs. high-growth Amazon/Salesforce) have vastly different ROICs and market valuations. This explains why ROIC is most useful when comparing similar types of companies.
Test your understanding!
An FP&A analyst is reviewing a company's performance. Here is some simplified financial data:
Income Statement:
- Operating Income (EBIT): $200 million
- Tax Rate: 25%
Balance Sheet:
- Total Debt (Book Value): $500 million
- Total Equity (Book Value): $700 million
- Cash & Cash Equivalents: $100 million
The company's WACC is estimated to be 10%.
- Calculate the company's ROIC. (Assume you are using end-of-period Invested Capital for simplicity).
- Based on your calculation, is the company creating or destroying value? Explain why.
Show answer
1. Calculation:
- NOPAT = EBIT * (1 - Tax Rate) = $200M * (1 - 0.25) = $150 million
- Invested Capital = Debt + Equity - Cash = $500M + $700M - $100M = $1,100 million
- ROIC = NOPAT / Invested Capital = $150M / $1,100M = 13.6%
2. Interpretation:
The company is creating value. Its ROIC of 13.6% is greater than its WACC of 10%. This means that for every dollar of capital deployed in the business, it is generating a return of 13.6 cents, which more than covers the 10-cent cost of that capital.
5. Advanced Adjustments for a Truer Picture
Standard ROIC calculations are a great start, but for industries like technology, pharmaceuticals, or retail, standard accounting can distort the true picture of invested capital. Top-tier analysts often make adjustments to get a more economically realistic view. Here are two of the most important ones, which are detailed in Professor Damodaran's paper:
- Capitalizing Research & Development (R&D): For a company like Pfizer or Google, R&D is its primary long-term investment. Accounting rules, however, require it to be expensed immediately. Capitalizing R&D (treating it as an asset that is amortized over time) provides a more accurate measure of invested capital and NOPAT. The section 'Capitalizing R&D Expenses' in resource LINK (pages 19-27) details this process.
- Capitalizing Operating Leases: For a retailer like Starbucks or an airline like Delta, leases on stores and aircraft are a major form of financing. Treating these off-balance-sheet leases as debt provides a more accurate picture of the capital the firm employs. The section 'Converting Operating Leases into Debt' in LINK (pages 31-37) explains this adjustment.
You don't need to master the mechanics of these adjustments right now, but being aware of them is what separates a good analyst from a great one. They demonstrate a deeper understanding of the economics behind the numbers.
Conclusion
You have now learned how to model and interpret one of the most powerful metrics in finance. By combining information from the income statement and the balance sheet, ROIC provides a holistic view of a company's performance that goes far beyond simple profitability.
Key Takeaways:
- ROIC measures the return a company earns on all the capital it has invested in its operations (both debt and equity).
- The formula is NOPAT / Invested Capital, and it's crucial to understand the conceptual reasons for how each component is calculated.
- The ultimate test of value creation is whether ROIC exceeds WACC.
- ROIC is a versatile tool for analyzing trends over time and comparing performance against similar peers.
- Advanced analysts refine their ROIC calculations by adjusting for items like R&D and operating leases to better reflect economic reality.
In our next and final lesson for this module, we will broaden our perspective. We've focused on financial metrics like Adjusted EBITDA and ROIC. Next, we will introduce the balanced scorecard framework, which integrates non-financial measures to create a more comprehensive and strategic view of performance management.