Hello! Welcome back to your course on building a personal finance dashboard.
In our last lesson, we established a professional naming convention for our worksheets and learned how to create named ranges using a Prefix_DataDescription format. This brought a great deal of clarity and organization to our workbook structure.
Today, we will address a fundamental challenge in any data-tracking project: how to ensure our formulas, charts, and summaries automatically update when we add new data. The solution is one of Excel's most powerful features: Tables. By the end of this lesson, you will be able to structure your raw data using Excel Tables, making your dashboard truly dynamic and saving you from the constant hassle of updating cell references.
Why Not Just Use a Regular Range of Cells?
Imagine you have a list of expenses in cells D2:D50 and you write a formula SUM(D2:D50) to get the total. Next month, when you add new expenses in cells D51:D60, your SUM formula is now incorrect. You would have to manually edit it to SUM(D2:D60). This is tedious, error-prone, and unsustainable for a dashboard meant to be used for years.
Excel Tables solve this problem elegantly.
How to Create a Personal Finance Dashboard in Excel
The article 'How to Create a Personal Finance Dashboard in Excel' from Graphed.com states this very clearly. Let's read why they consider this a 'non-negotiable step'.
Please read 'Phase 1', focusing on 'Step 2: Add Some Data and Format as a Table'. The key takeaway is in the final paragraph, which explains why making your data a Table is essential for a dynamic dashboard.
An Excel Table is not just a formatted range of cells; it's a special object that Excel recognizes and manages. It knows where it begins and ends, and most importantly, it can grow.
Creating and Naming Your First Table
Let's turn our theoretical transaction log into a proper Excel Table.
- Navigate to your Transactions worksheet.
- Set up the following headers in cells A1 through E1:
DateDescriptionCategoryAmountType(This will be for 'Income' or 'Expense')
- Enter one or two sample transactions below the headers so the range has some data.
Now, let's convert this range into a Table.
Only 1% of Excel Users Know Excel Tables! STAND OUT from the Crowd!
The video 'Only 1% of Excel Users Know Excel Tables!' from MyOnlineTrainingHub provides an excellent walkthrough of creating and managing tables. We'll start with the basics.
Watch from the beginning to 02:27. This segment will show you how to convert a range into a Table using the Ctrl+T shortcut, and most importantly, how to rename the table from its default name (like 'Table1') to something meaningful.
Following the video's instructions, convert your transaction data into a Table. Once created, a new "Table Design" tab will appear in the ribbon. Use this tab to rename your table.
Consistent with our naming convention from the last lesson, let's adopt a prefix for tables: tbl_.
- Rename your new table to
tbl_Transactions.
This simple step of renaming is crucial for the next major concept: structured references.
The Power of Dynamic Behavior
This is where Excel Tables truly shine. They automatically handle tasks that are manual and error-prone in regular ranges.
1. Automatic Expansion
When you add a new row of data directly below a Table (or press the Tab key in the very last cell), the table automatically expands to include the new row. This means your data container grows with your data, with no manual resizing needed.
2. Auto-Filled Formulas
This is a huge time-saver. If you enter a formula into one cell of a column, the Table automatically copies that formula down to all other rows in that column.
Make the Ultimate Personal Finance Tracker in Excel (+ Free Template)
Let's watch a practical example of this in the context of a personal finance tracker from Kenji Explains.
Watch from 00:24 to 02:33. Pay close attention to how he first converts the data to a Table (Ctrl+T) and then adds a formula to calculate the month. Notice how the formula instantly fills down the entire column. Also, see how adding a new transaction at the bottom automatically expands the table.
3. Structured References
This is the most important benefit for our dashboard. Instead of using cell references like D2:D100, Tables allow you to use a more readable, structured syntax that refers to the table and column names.
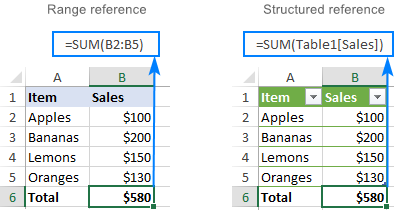
The syntax is TableName[ColumnName]. For our transactions table, a formula to sum all amounts would be:
=SUM(tbl_Transactions[Amount])
This formula will always sum the entire Amount column, whether it has 10 rows or 10,000 rows. You never have to edit it again. This is the key to making your dashboard dynamic.
Test your understanding!
You've created the tbl_Transactions table. You use the formula =SUM(tbl_Transactions[Amount]) in a cell to calculate your total spending. Over the next month, you add 30 new expense transactions to the bottom of the table. What change do you need to make to your SUM formula to ensure it includes these new transactions?
Show answer
Absolutely nothing! Because you used a structured reference (tbl_Transactions[Amount]), the formula is already pointing to the entire column within the table. As the table expanded to include the 30 new rows, the formula's scope updated automatically. This is the core benefit of using Tables.
Exploring Other Table Features
Excel Tables come with a host of other useful features that streamline data analysis.
Only 1% of Excel Users Know Excel Tables! STAND OUT from the Crowd!
Let's return to the MyOnlineTrainingHub video to explore some of these features.
Please watch the following segments: 04:22 - 06:16: This shows the 'Total Row' feature, which allows you to quickly add calculations like SUM, AVERAGE, or COUNT to the bottom of your table. 06:16 - 08:30: This demonstrates the core concepts of automatic expansion and formula propagation when new data is added, reinforcing what we've discussed. 11:25 - 12:59: This provides an excellent preview of a future topic. It shows that PivotTables built on an Excel Table update automatically when you refresh them, because their data source is the dynamic table name, not a fixed range.
To quickly summarize the benefits of using Tables:

Conclusion
You have now learned the foundational technique for building a dynamic dashboard. By structuring your raw data in an Excel Table, you've ensured that your entire workbook can automatically adapt as you add new financial data over time. This eliminates the most common point of failure in spreadsheets and sets a professional standard for your project.
Key Takeaways:
- An Excel Table is a dynamic object, not a static range of cells.
- Use the
Ctrl+Tshortcut to quickly convert a range into a Table. - Always give your tables a meaningful name (e.g.,
tbl_Transactions) via the Table Design tab. - Tables automatically expand to include new rows and can auto-fill formulas down a column.
- Structured references (e.g.,
tbl_Transactions[Amount]) are the key to creating formulas and charts that update automatically.
In our next lesson, we will focus on designing a user-friendly data entry sheet. We will build upon the tbl_Transactions table we created today and add features like drop-down menus to make the process of logging your income and expenses fast, consistent, and error-free.