Hello! Welcome to your first lesson.
This course is designed to guide you step-by-step in building a comprehensive personal finance dashboard in Excel. Given your extensive background in personal finance, we won't spend time on the "what" and "why" of tracking metrics like savings rates or portfolio performance. Instead, we'll focus directly on the practical "how" of implementing these concepts in a powerful and well-organized Excel workbook.
Today, we'll start with the most critical first step: designing the architecture of your workbook. Just as you wouldn't build a house without a blueprint, we won't start entering data without a solid plan. By the end of this lesson, you will be able to design a multi-sheet workbook that cleanly separates your data, your calculations, and your final dashboard presentation.
The Principle of Separation: Why Not Use One Big Sheet?
While it might seem tempting to put everything onto a single worksheet, this approach quickly becomes unmanageable and error-prone for a project of this scale. A well-structured workbook, used by professionals, follows a principle of separation of concerns. This means each component of your dashboard system has its own dedicated place.
The core benefits of this approach are:
- Maintainability: When you need to add new transaction data or update a formula, you'll know exactly where to go.
- Reduced Errors: By keeping your raw data untouched by complex formulas on the same sheet, you minimize the risk of accidentally deleting or overwriting crucial information.
- Scalability: As you add months or even years of financial data, a structured workbook can handle the growth without becoming slow or cluttered.
- Clarity: It's easy to distinguish between raw inputs, the analytical "engine," and the final visual report.
A great way to think about this is to separate your workbook into four main types of worksheets.
Excel Workbook Best Practices: Tips for Effective ...
The article 'Excel Workbook Best Practices' provides a clear, concise summary of this structural logic. Please read the section on structuring your data logically.
In the article, locate the heading '2. Structure Data Logically' and read the three bullet points under it. Notice the clear distinction between raw data, calculations, and summary sheets.
This separation is a fundamental best practice in any data analysis project. To see it explained in a slightly different way, let's watch a short video segment.
Do's & Don'ts of Excel Spreadsheet Design (with Examples)
In this video, 'Do's & Don'ts of Excel Spreadsheet Design', Leila Gharani explains this exact principle with a practical example.
Watch from the timestamp 00:38 to 01:18. Pay attention to how she describes the distinct purpose of the 'Data', 'Dashboard', 'Calculation', and 'Control' tabs.
Visualizing the Structure
Let's look at what this structure looks like in practice.
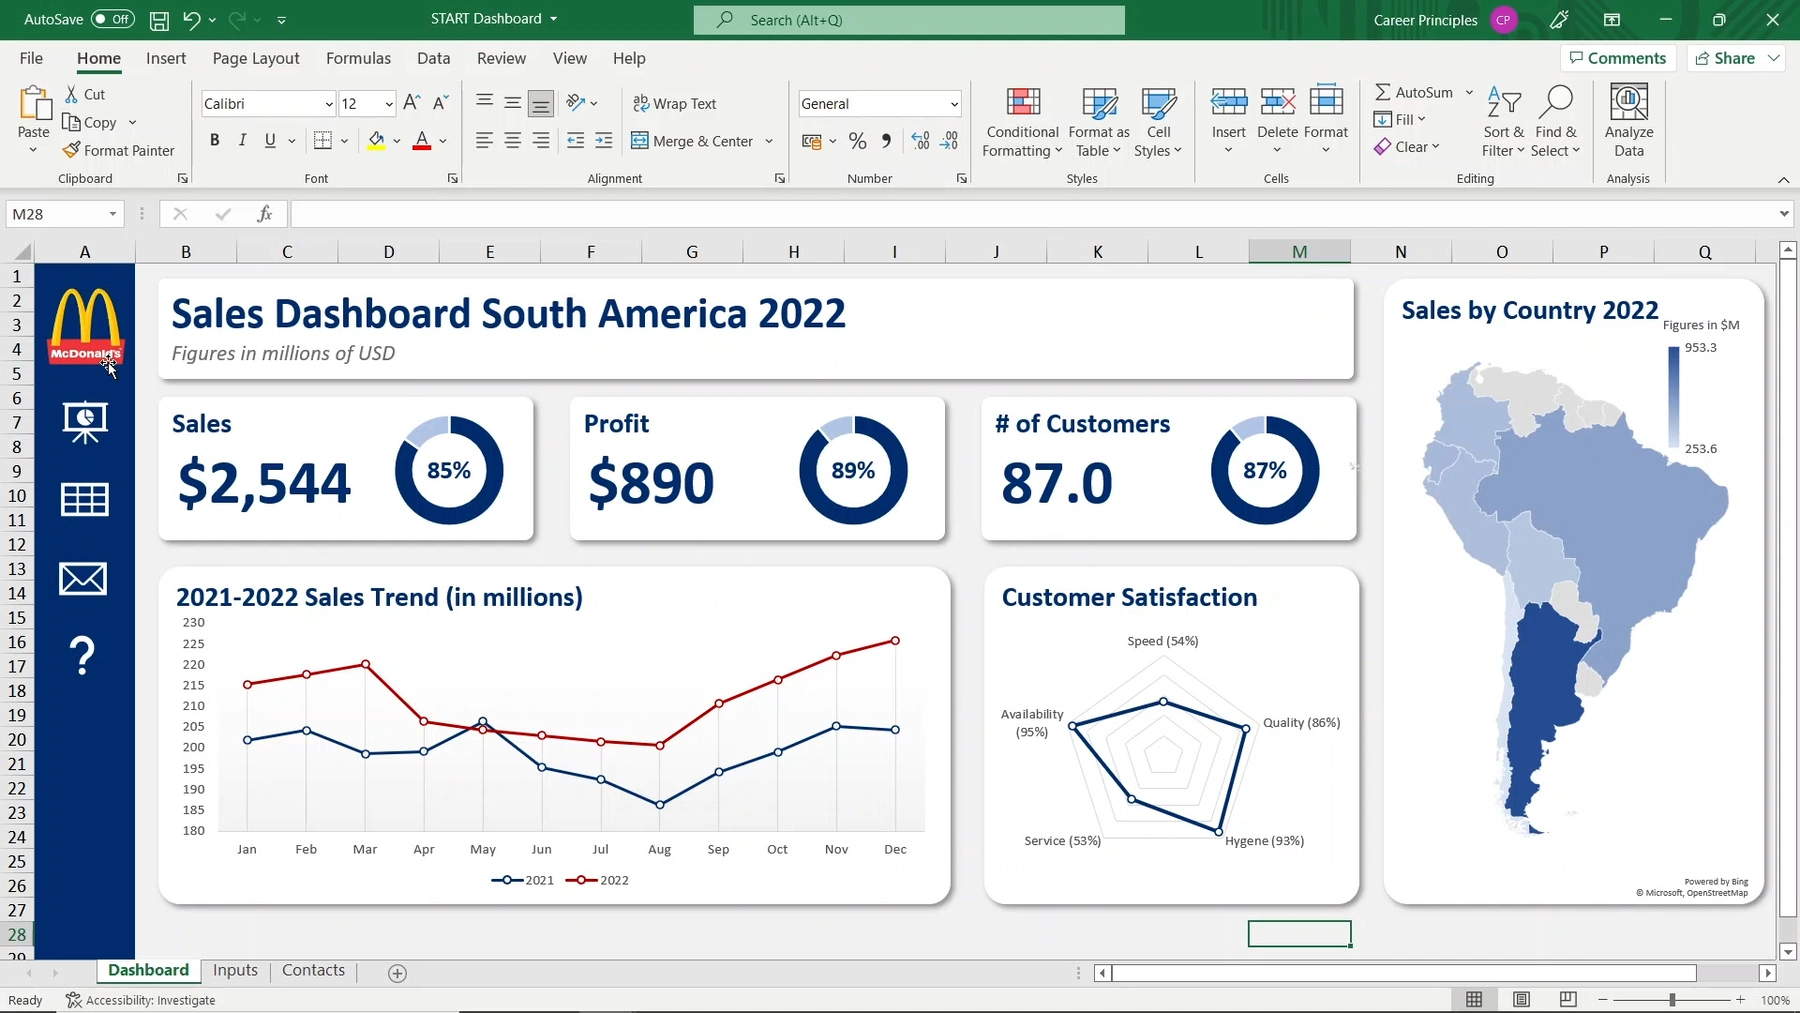

Now, let's see a financial dashboard example that uses this structure.
Interactive Personal Finance Dashboard with FREE EXCEL TEMPLATE
The video 'Interactive Personal Finance Dashboard' provides a great walkthrough of a finished product. We will watch a segment where the presenter introduces the different sheets in his file.
Watch from 00:43 to 01:40. Note the different sheets he uses: 'Dashboard' for the report, 'Transaction' for the raw data, and 'Data Validation' for lists of categories (we'll call this a 'Lists' or 'Settings' sheet).
Designing Your Personal Finance Workbook
Now it's time to apply these principles. Open a new, blank Excel workbook. We are going to create the foundational sheet structure for your personal finance dashboard.
Based on the comprehensive dashboard you aim to build, I recommend the following set of worksheets. Please create a new sheet for each item in the list and rename it accordingly. You can rename a sheet by right-clicking its tab at the bottom of the screen and selecting "Rename".
- Dashboard: This will be the main presentation layer. It will eventually contain all your charts, key metrics, and summaries. It should be visually clean and easy to read. For now, it's just a blank sheet.
- Calculations: This is the "engine room" of your workbook. We'll use this sheet to perform intermediate calculations, create summary tables, and house the PivotTables that will feed your dashboard charts. This sheet will eventually be hidden from view.
- Lists: This is a configuration sheet. Here, you'll define all the lists for your drop-down menus, such as expense categories (e.g., Groceries, Utilities, Transport), income sources, asset classes, and more. This ensures consistency across your entire workbook.
- Transactions: This is your primary data entry sheet for day-to-day income and expenses. Every time you spend or earn money, you'll record it here.
- Investments_Log: This sheet will track all your investment-related transactions: buying securities, selling them, and receiving dividends or interest.
- Price_Input: Since you'll be updating prices manually, this sheet will have a simple table where you can enter the latest price for each of your investment holdings (stocks, funds, etc.).
- Liabilities: Here you will list all your debts (mortgages, car loans, credit cards) along with their balances, interest rates, and minimum payments.
- Assets_NonInvest: This sheet is for tracking the value of significant assets that aren't part of your investment portfolio, such as your primary residence, vehicles, or cash in bank accounts.
- README: This is a documentation sheet. It’s good practice to have a sheet that explains the purpose of each tab, where to enter data, and a log of any major changes you make to the file. This will be invaluable if you step away from the project for a while or if you ever want to share it.
Your new workbook should now have these nine tabs at the bottom. This structure directly maps to the financial areas you want to track and provides a robust, scalable foundation for the entire project.
Test your understanding!
Imagine you just paid your monthly rent and you want to record this in your new workbook. On which sheet would you enter this transaction?
Show answer
You would record the rent payment on the Transactions sheet. This sheet is the designated place for all your day-to-day income and expense records.
Test your understanding!
You decide you want to start tracking a new expense category called "Hobbies". On which sheet would you add this new category so it can be used for future data entry?
Show answer
You would add "Hobbies" to a table on the Lists sheet. This sheet acts as the central repository for all such categories, ensuring your data entry remains consistent.
Conclusion
In this lesson, you've laid the architectural groundwork for your entire personal finance dashboard. This is the most important step in ensuring your final product is robust, easy to maintain, and scalable for the future.
Key Takeaways:
- Separation of Concerns: The best practice for complex Excel workbooks is to separate data, calculations, and presentation into different worksheets.
- A Four-Part Structure: A typical structure includes sheets for Data (Transactions, Logs), Calculations (the "engine"), Presentation (the Dashboard), and Settings (Lists).
- Your Workbook Blueprint: You have created a specific nine-sheet structure tailored to the goal of building a comprehensive personal finance dashboard.
In our next lesson, we'll build directly on this foundation. Now that we have our sheets, we need to give them, and the data tables within them, clear and consistent names. This will make our formulas much easier to write and understand as we begin to build out the dashboard's logic.