Welcome! In our last lesson, we explored HTML comments, learning how to leave notes for ourselves and other developers directly within our code. This was the final piece of the fundamental structure of an HTML document.
Today, we'll bridge the gap between the code you write in your editor and what you see in the browser. This lesson focuses on the practical workflow of a web developer. You will learn how to create and open an .html file efficiently and, most importantly, how to use the browser's built-in "Developer Tools" to inspect the live structure of your webpage. This tool is arguably the most important one in a web developer's toolkit, and mastering it early will be a significant advantage. By the end of this lesson, you will have completed the foundational module of this course.
From Code to Browser: A Developer's Workflow
So far, you've created an index.html file and have likely been opening it by finding the file on your computer and double-clicking it. This works, but it requires you to manually refresh the browser every time you make a change. Let's look at a more professional and efficient workflow.
This short video from Web Dev Simplified will first review the basic process of creating and opening an HTML file, and then introduce a powerful tool to automate this process.
Introduction to HTML || Your First Web Page || Part 1
This video demonstrates the fundamental process of creating and opening an HTML file, and then introduces the "Live Server" extension for VS Code, which dramatically improves the development workflow.
Please watch the following segments: Creating and Opening a File: This is a quick review of the process you're already familiar with—saving a file with an .html extension and opening it in a browser. Introducing Live Server: Pay close attention here. The video explains the problem of manual refreshing and shows how to install and use the Live Server extension in VS Code. This tool automatically reloads your page whenever you save your file.
As you saw, Live Server starts a small, local web server on your computer. This more closely mimics how a real website works and provides the huge benefit of live reloading.
Your Turn: Set Up Live Server
- Open VS Code.
- Go to the Extensions view (the icon with four squares in the sidebar).
- Search for "Live Server" (by Ritwick Dey).
- Click "Install".
- After it's installed, open your
index.htmlfile. You should now see a "Go Live" button in the bottom-right corner of your VS Code window. - Click "Go Live". Your
index.htmlfile should open in your default browser with a URL that looks something likehttp://127.0.0.1:5500/index.html.
Now, try making a small change to the text in your <h1> tag and save the file. The browser should update instantly without you having to do anything!
Peeking Under the Hood: Browser Developer Tools
Every modern web browser comes with a powerful suite of tools for developers. These "DevTools" allow you to look at a webpage's underlying code, diagnose problems, and test changes in real-time.
When you view a page in DevTools, you are not looking at your original .html file. Instead, you are looking at the Document Object Model (DOM). The DOM is the browser's internal, live representation of your page's structure. It's a tree of objects that the browser creates after reading and interpreting your HTML code.
There are several ways to open DevTools. The following image shows how to find it in the Google Chrome menu.
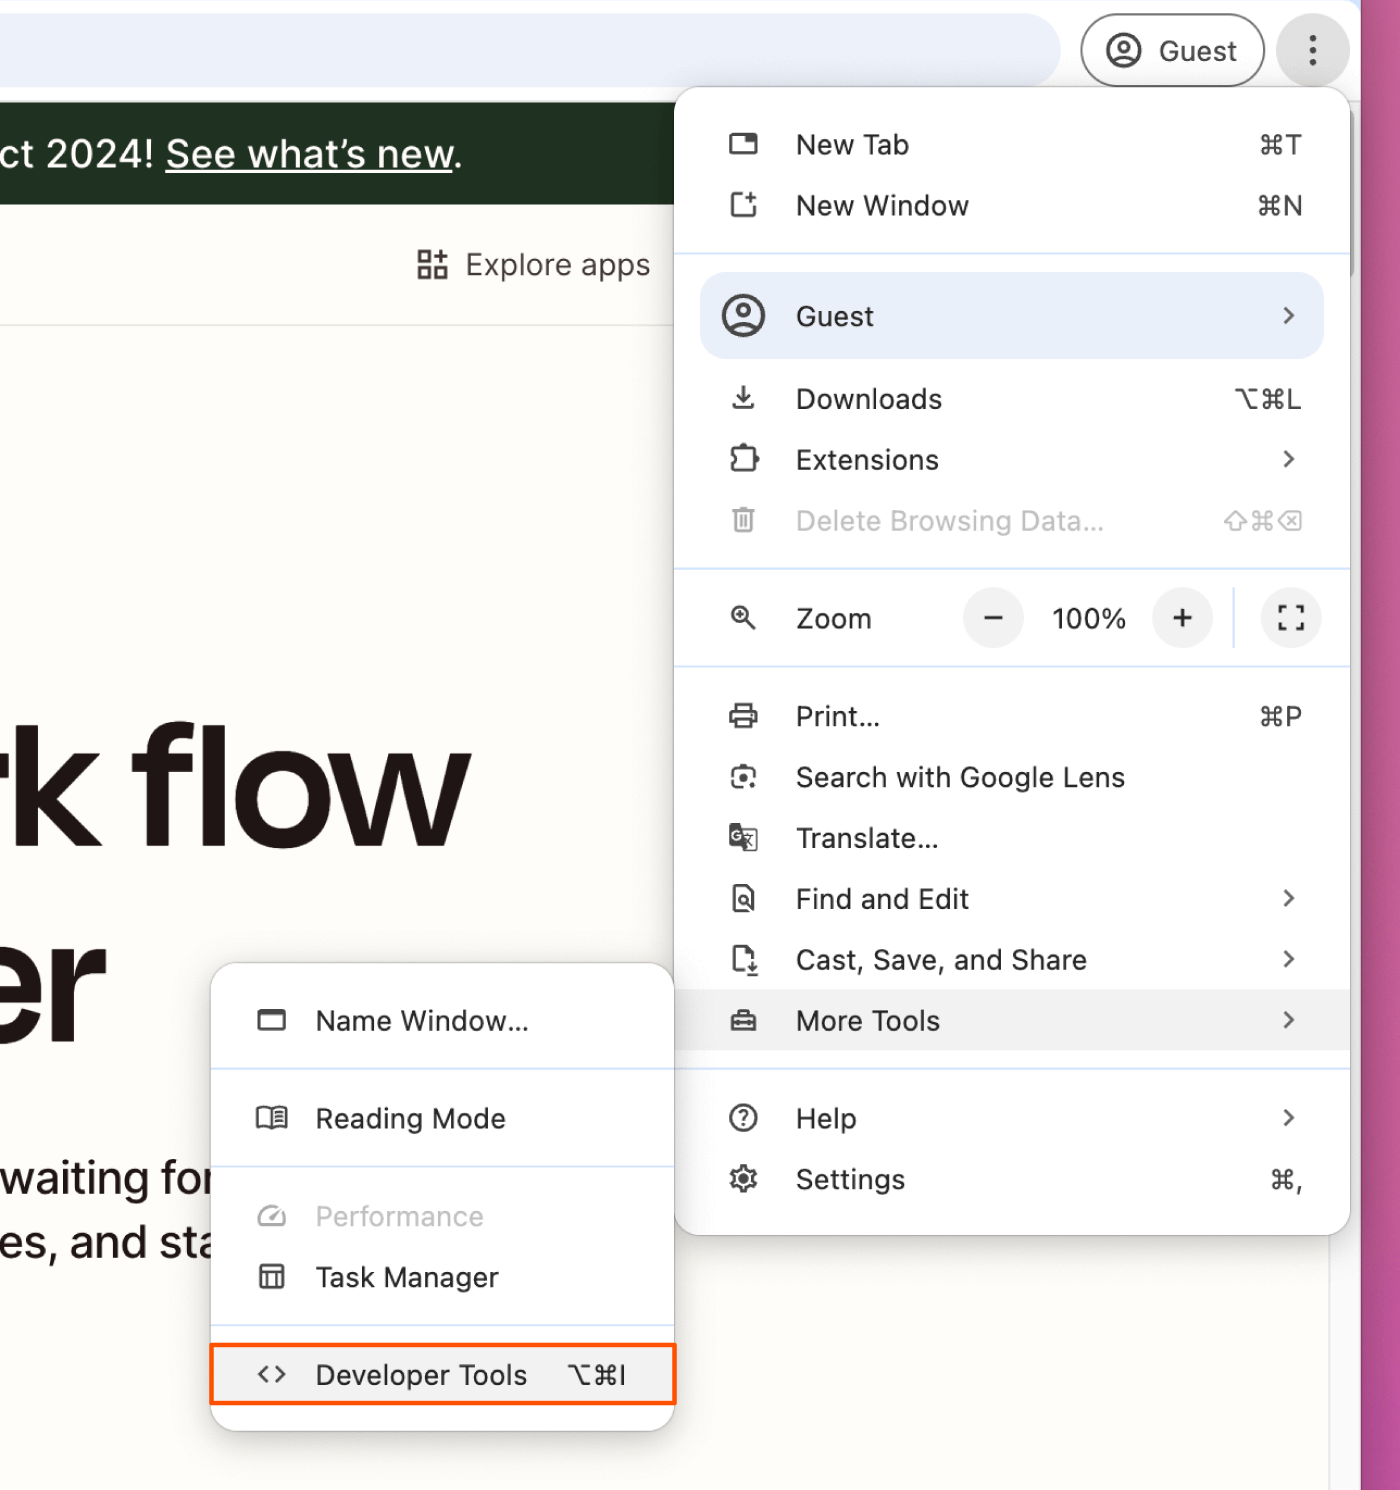
While using the menu works, most developers use a keyboard shortcut. Let's watch a short video that demonstrates the common methods for opening the tools and introduces the most important panel for our purposes: the Elements panel.
Use Chrome's Inspect Tool Effectively
This video from Julia F Morgado clearly demonstrates four ways to open the Chrome DevTools and gives an excellent overview of how to navigate the Elements panel.
Please watch these two sections: Opening the Inspector: This covers the different methods, including right-clicking and the keyboard shortcuts (Ctrl+Shift+C on Windows, Cmd+Option+C on Mac). Exploring the Elements Tab: This part shows how the Elements tab displays the page's HTML (the DOM). You'll see how to hover over code to highlight elements on the page and, crucially, how to use the "element picker" tool to select an element on the page and see its corresponding code.
Your Turn: Inspect Your Page
With your index.html page open (served by Live Server), try the following:
- Open the Developer Tools using the
Ctrl+Shift+Cshortcut. This should open them with the element picker already active. - Move your mouse over the "Hello, World!" heading on your page. Notice how it gets highlighted and a tooltip appears.
- Click on the heading. The DevTools panel should now highlight the
<h1>line in the Elements tab. - In the Elements tab, find the HTML comment you wrote in the previous lesson. This confirms you are seeing the full structure that the browser has parsed.
The image below illustrates what you should be seeing: the element picker is active (blue icon in the top left of the panel), and hovering over an element on the page reveals its properties and highlights its code in the Elements panel.

A Playground for Experimentation
One of the most powerful features of the DevTools is the ability to edit the DOM on the fly. These changes are temporary; they are only made in the browser's memory and will disappear as soon as you reload the page. This makes DevTools a safe and perfect sandbox for testing out changes without affecting your actual source code.
Let's see this in action.
Use Chrome's Inspect Tool Effectively
Continuing with the same video, we'll now see how to make temporary edits to the page's content and styles.
Altering the Code: Watch how you can change text, delete elements, and even add new HTML directly in the Elements panel. Notice the key moment when the presenter refreshes the page and all changes are gone. A Glimpse at Styles: This part introduces the "Styles" pane, which shows the CSS applied to a selected element. We won't dive deep into this now, but it's a great preview of how you will debug your CSS in future lessons.
Your Turn: Experiment!
Now it's your chance to play.
- In the Elements panel, find your
<h1>element. Double-click the text inside it (e.g., "Hello, World!") and change it to something else. Press Enter. You should see the change immediately on your page. - Right-click on your entire
<p>element in the Elements panel and select "Delete element". The paragraph will vanish from the page. - Now, press
F5or the refresh button in your browser.
Your page will revert back to its original state, exactly as it is in your index.html file. This ability to experiment freely is what makes DevTools an indispensable part of web development.
Conclusion
Congratulations, you've completed the first module! You now understand the entire basic workflow, from writing code in an editor to viewing and inspecting it in a browser using professional-grade tools.
Key Takeaways:
- Creating an
.htmlfile and opening it in a browser is the fundamental loop of web development. - The "Live Server" VS Code extension automates browser refreshing, creating a more efficient workflow.
- Browser Developer Tools let you inspect the live Document Object Model (DOM), which is the browser's representation of your HTML.
- The Elements panel is your primary tool for viewing the page's HTML structure.
- You can use the element picker to select visual elements and see their code.
- Changes made in DevTools are temporary, providing a safe environment for testing and debugging.
In our next lesson, we will begin a new module, "Integrating with CSS and JavaScript." You'll learn how to link an external CSS stylesheet to your HTML document to start adding style and design to your page. The inspection skills you've learned today will be immediately useful for seeing how those styles are applied.