Introduction
In our last lesson, we focused on performance bottlenecks, specifically how to detect and mitigate hotspots in distributed systems. We saw that proactive scheduling and client-side adaptations are crucial for maintaining low latency. Today, we shift our perspective from pure performance to a related and equally critical concept: resource efficiency. At Google's scale, where infrastructure costs are measured in billions of dollars, the ability to do more with less is not just an optimization—it's a core business imperative.
This lesson directly addresses the learning outcome: Describe methods for analyzing and improving resource efficiency (CPU, memory, network) in large-scale systems. As a prospective Principal Engineer, your influence extends beyond designing functional systems to ensuring they are economically viable and sustainable. A one-percent efficiency gain across the fleet can translate into hundreds of millions of dollars in savings, and you will be expected to identify and drive such initiatives.
We will first explore how to analyze resource usage at scale, using Google's own fleet-wide profiling systems as a case study. Then, we will delve into the specific methods Google employs to improve efficiency, including sophisticated scheduling policies, resource reclamation, and automated scaling.
Analyzing Resource Usage at Scale
The first rule of optimization is that you cannot improve what you cannot measure. In a distributed environment with tens of thousands of machines running millions of tasks, "measuring" is a formidable data engineering challenge. You need a system that can continuously collect detailed performance data from every corner of the fleet with negligible overhead.
Google's solution to this is a system called Google-Wide Profiling (GWP). It provides the foundational data for almost all large-scale efficiency analysis.
This paper provides an excellent overview of how Google approaches performance analysis at the datacenter level. It details the architecture of GWP and the kinds of insights it enables.
Please read the following sections: The introduction, which sets the stage for why continuous, low-overhead profiling is critical (first two paragraphs). The section discussing the challenges and questions GWP can answer (first two paragraphs of page 66). The description of the GWP infrastructure and collection methods (pages 66-67). Focus on the "two-dimensional sampling" approach and the types of profiles collected (whole-machine vs. per-process). The section on profile uses, particularly for understanding cloud applications and finding hot shared code (pages 74-75). Pay attention to how GWP solves the overhead problem and what specific metrics (CPU cycles, cache misses, heap allocations, etc.) are collected to build a complete picture of resource consumption.
As the paper highlights, GWP's genius lies in its two-dimensional sampling strategy: it profiles only a small, random subset of machines at any given time, and on those machines, it uses standard event-based sampling. This combination keeps the fleet-wide overhead below 0.01% while still collecting a statistically representative dataset.
This rich dataset allows engineers to answer critical efficiency questions:
- What are the most CPU-intensive functions across the entire fleet? (As the paper notes, this identified
zlibas consuming 5% of all cycles, motivating a company-wide optimization effort). - Which applications are "memory hogs"?
- How does the performance of an application differ across software versions or hardware platforms?
This continuous, fleet-wide view is the starting point for all major efficiency improvements.
Strategies for Improving Resource Efficiency
Once you can accurately measure resource consumption, you can begin to optimize it. At Google, this is primarily achieved through the cluster manager, Borg. Let's explore the key strategies it employs, many of which have direct counterparts in its open-source successor, Kubernetes.
A 2020 paper analyzing a decade of Borg's evolution provides incredible insights into this.
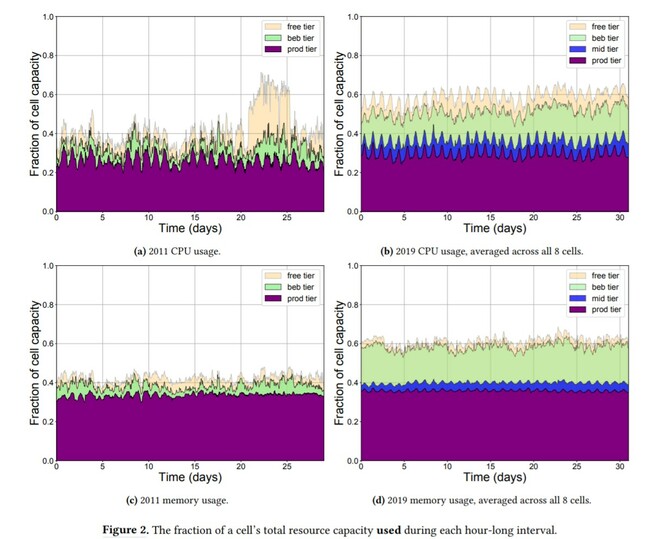
Strategy 1: Statistical Multiplexing and Overcommitment
The most significant efficiency gain comes from a simple observation: most jobs don't use all the resources they request. This gap between the requested limit and the actual usage is called "slack."
There are valid reasons users over-request resources, as John Wilkes explains in his talk on Borg.
Cluster Management at Google with Borg • John Wilkes • GOTO 2016
In this segment of his GOTO 2016 talk, John Wilkes, one of the original Borg authors, explains the practical and economic realities behind resource allocation at Google.
Please watch the section where he discusses why users over-request resources and how Borg reclaims this slack, from request vs. usage. He explains that users pad requests to handle load spikes (like Michael Jackson's death) and to avoid being killed for exceeding their memory limit.
Borg turns this "wasteful" slack into a massive efficiency win by using it to run low-priority, non-latency-sensitive "best-effort batch" jobs. Production jobs get a reservation based on their recent usage, which Borg guarantees. The space between this reservation and their padded limit is then "reclaimed" and offered to batch jobs.
This policy of co-locating production and batch workloads has a staggering economic impact.
Cluster Management at Google with Borg • John Wilkes • GOTO 2016
Here, Wilkes quantifies the cost savings of running production and batch jobs together versus in separate, dedicated clusters.
Watch the segment from quantifying the savings. The key takeaway is that running a shared workload requires, on average, 25% fewer machines than running the workloads separately.
A 25% reduction in the size of Google's fleet represents a multi-billion dollar saving. This is a clear example of how a technical decision in system design directly drives business value.
The "Borg: the Next Generation" paper provides the data to back this up.
[PDF] Borg: the Next Generation
This paper analyzes Google's 2019 cluster data. We'll look at the data showing overcommitment.
First, examine Figure 4 in the paper (the paragraph below it). Notice that the allocated CPU and memory are consistently well above 100% of the cell's physical capacity. This is overcommitment in action. Then, compare this with Figure 2, which you can also see in the image above our section. It shows that the actual used resources are only around 50-60% of capacity. The difference between allocation and usage is the slack that Borg exploits.
Strategy 2: Fine-Grained and Automated Resource Allocation
Another source of inefficiency is "internal fragmentation" caused by rigid resource allocation units.
-
Fine-Grained Requests: Many cloud platforms offer fixed T-shirt sizes (small, medium, large VMs). If your job needs 2.1 cores, you have to request 4, wasting 1.9 cores. Borg avoids this by allowing users to request resources with high precision (e.g., to the millicore or byte). Wilkes' talk reveals that forcing power-of-two rounding would require 30% more machines (
cost of rounding up in resource LINK). This is the motivation behind Google Cloud's custom machine types. -
Automated Vertical Scaling: Even with fine-grained requests, asking developers to perfectly specify them is unrealistic. To solve this, Google developed Autopilot, a system that automatically adjusts a task's resource limits based on its historical and current usage.
[PDF] Borg: the Next Generation
This section of the Borg paper introduces Autopilot and shows its effectiveness.
Please read Section 8, Vertical scaling (the entire section). Focus on Figure 14, which shows a clear reduction in "peak NCU slack" for jobs managed by Autopilot compared to those configured manually. This directly translates to less waste and higher efficiency.
Strategy 3: Affinity-Based Scheduling
The most sophisticated schedulers go beyond simple bin-packing of resource quantities and consider the affinity between workloads and hardware.
-
CPU Affinity: An application's code may run more or less efficiently (measured in Cycles Per Instruction, or CPI) on different processor microarchitectures. The GWP paper you read earlier describes how profiling data can be used to measure this. A smart scheduler can use this data to place jobs on the hardware where they run fastest, improving overall throughput. The paper estimates this could yield a 10-15% improvement in fleet-wide efficiency.
-
Network Affinity: In our previous lesson, we discussed how Borg can perform hotspot-aware task placement to avoid overwhelming Top-of-Rack network switches. This is another form of affinity scheduling, where the scheduler considers network topology and utilization to improve network efficiency. At an even more advanced level, Google's datacenter fabric itself can be reconfigured.

This ability to dynamically re-wire the network based on observed traffic patterns is a powerful tool for maximizing network efficiency, ensuring that bandwidth is allocated where it's most needed.
The Challenge of "Hogs and Mice"
A final, crucial insight from the analysis of Google's workload is its extremely heavy-tailed nature.
[PDF] Borg: the Next Generation
This paper introduced the "hogs and mice" characterization of Google's workload, which has profound implications for scheduling.
Please read the following parts of Section 7, Resource consumption: The paragraph that defines "hogs and mice" (hogs and mice definition). The paragraph on the implications for queueing delay (Section 7.3).
The key finding is that the top 1% of jobs ("hogs") consume over 99% of all resources. The remaining 99% of jobs ("mice") use a tiny fraction. From queueing theory, we know that systems with high service time variance (a high squared coefficient of variation, or ) suffer from long queueing delays, as small jobs get stuck behind large ones. The paper notes that Google's workload has an incredibly high of over 23,000.
This implies that a critical strategy for both efficiency and performance is to design schedulers that can isolate the "mice" from the "hogs," allowing the vast majority of jobs to run in what feels like a very lightly loaded system.
A Systems View of Performance Engineering
While we've focused on Google's specific solutions, the underlying principles are universal. A talk from a performance engineer at Twitter provides an excellent framework for thinking about this problem more broadly.
Effective Performance Engineering at Twitter-Scale
This talk from InfoQ frames large-scale performance engineering as a data engineering problem, which neatly summarizes the approaches we've discussed.
Watch the following segments: First, the speaker's definition of performance as a "counting exercise" on top of a system model, from systems thinking. Next, how this model is applied to a local application stack, collecting metrics from all layers, from local runtime model. Finally, how the model is extended to a distributed system, using tracing to build a graph of service interactions and perform counting on its edges, from distributed model.
This perspective reinforces everything we've seen: effective resource management begins with building a model of your system, establishing a comprehensive data collection pipeline (like GWP), and then performing analysis—a "counting exercise"—on that data to drive optimization. The mention of using eBPF for low-overhead, high-granularity data collection is a nod to the modern tooling used for this purpose at many large tech companies.
Conclusion
In this lesson, we moved from the tactical problem of hotspot mitigation to the strategic challenge of fleet-wide resource efficiency. You've seen that at Google's scale, efficiency is not an afterthought but a central design driver, saving billions of dollars and enabling more work to be done with the same physical hardware.
Your key takeaways are:
- Analysis is paramount: You can't optimize what you can't measure. Systems like Google-Wide Profiling provide the continuous, low-overhead, fleet-wide data needed to identify inefficiencies.
- Reclaim all waste: The largest efficiency gains come from statistical multiplexing—reclaiming the "slack" between requested and used resources to run lower-priority workloads.
- Allocation matters: Efficiency is improved by avoiding fragmentation through fine-grained resource requests and by automating resource allocation with tools like Autopilot to eliminate human error and guesswork.
- Be affinity-aware: The best schedulers consider the affinity between workloads and hardware (both CPU and network) to maximize throughput.
- Isolate hogs from mice: Recognizing and managing the heavy-tailed nature of workloads is critical for ensuring that the vast majority of small jobs see good performance.
In our next lesson, we will build on this foundation. We will learn how to formulate a capacity plan for a distributed system considering growth forecasts and SLOs. Now that you understand how to measure and maximize the efficiency of your current resources, the next logical step is to predict how many resources you'll need in the future.