Introduction
Welcome to the final lesson of our module on Applied Quantitative Methods. In our previous sessions, we've established a robust toolkit for analysis. We started by designing single-case experiments (SCEDs) to test interventions, created tracking tools for repeated measures, and then explored both Bayesian and frequentist methods to analyze the resulting data. Last time, we focused specifically on formal pre-post analysis using tools like the paired t-test and ANCOVA to answer the question, "Did the intervention have a statistically significant effect?"
Having the right numbers is only half the battle. To be truly effective, you must communicate those findings in a way that is clear, compelling, and meaningful to your clients. This lesson bridges the gap between your rigorous analysis and your client-facing communication. We will directly address the learning outcome: Construct compelling data visualizations (e.g., run charts, annotated graphs) to illustrate trends for non-technical clients. We'll move beyond simply plotting data to mastering the art of data storytelling, transforming your analytical insights into a powerful narrative that demonstrates progress and reinforces the value of your work.
The Anatomy of a Clear Client Graph
Before we can tell a story, we need a clean canvas. In the context of your SCED and pre-post designs, the most common and effective canvas is a time-series line graph. The goal is not just to be technically correct, but to be immediately understandable to someone without a statistical background. The field of Applied Behavior Analysis (ABA) has developed a clear set of conventions for this, which are perfectly suited to your consulting work.
ABA Graphs and Visual Analysis: Types, Elements, and Examples
This article from Artemis ABA provides an excellent foundation in the practical elements of constructing graphs for behavioral interventions. It establishes a shared vocabulary for what makes a graph clear and interpretable.
First, read the section on Key Elements in an ABA Graph. Pay special attention to the descriptions of phase lines and phase labels, as these are the critical elements for visually separating baseline ('A') and intervention ('B') periods in your client charts. Next, review the Best Practices for ABA Graphing. Focus on the advice regarding an appropriate time scale, proportional axes, and the use of objective language in figure captions. These practices ensure your graphs are professional and not misleading.
A well-constructed graph serves as the foundation. Consider this example of an A-B-A design.

This graph effectively uses the core elements you've just read about. It's clean, clearly labeled, and the phase line makes the impact of the intervention immediately apparent. This is your starting point.
From Simple Plot to Systematic Analysis: Run Charts
A basic line graph shows the data, but a run chart helps you systematically interpret it. Given your background in operations research, you can think of this as a simplified form of statistical process control, applied to client behavior or satisfaction. A run chart is simply a line graph with a center line, typically the median, added to help detect non-random patterns.
A guide to creating and interpreting run and control charts
This guide from the NHS provides a robust framework for using time-series charts for improvement, which is directly analogous to your coaching work. It formalizes the process of visual analysis.
First, review the section The importance of time-based measurements on pages 4-5. It shows a powerful example of how aggregated pre-post data can be misleading compared to a time-series view. Next, read about the elements of a run chart and the definition of a "run" on pages 6-7. This introduces the median as the center line. Finally, and most importantly, study the four rules for identifying special cause variation on page 9. A shift (6+ points on one side of the median) or a trend (5+ points consistently increasing or decreasing) are strong visual signals that a real change has occurred.
Applying these rules gives you a structured way to talk about the data. Instead of just saying "it looks like it went up," you can state, "After the intervention, we see a clear shift, with eight consecutive data points falling above the baseline median. This is a strong indicator that the change is not random." This adds a layer of analytical rigor to your visual interpretation, even before formal statistical testing.
Leveraging Your Expertise: Control Charts for Intervention Analysis
Run charts are simple and effective, but your statistical background allows you to use a more powerful tool: the control chart. A control chart is a run chart on steroids. Instead of a median, it uses the mean as the center line and adds upper and lower control limits (UCL and LCL), typically set at +/- 3 standard deviations from the mean. These limits define the range of expected random variation (common cause variation).
The true power of a control chart in your practice is in evaluating interventions. The process is straightforward:
- Calculate the mean and control limits using only the baseline (pre-intervention) data.
- Freeze these lines and extend them across the entire graph.
- Plot the intervention data.
- Look for signals of "special cause" variation in the intervention phase.
A special cause—such as a point outside the control limits or a run of 8+ points above the baseline mean—is strong statistical evidence that the process has fundamentally changed. This provides a compelling visual complement to the p-value you'd get from a t-test.
A guide to creating and interpreting run and control charts
This guide provides the necessary details to upgrade from run charts to the more statistically robust control charts.
Begin by reading the section on Elements of a control chart (pages 12-13) to understand the key differences from a run chart (mean and control limits). Next, quickly review the decision tree on page 16. For most of your client data, like daily satisfaction scores, you'll be dealing with single observations of variable data, making the XmR chart the most common choice. Finally, read the three pages on testing a process change (pages 26-28). This section demonstrates exactly how to use a control chart to visually prove that an intervention has created a statistically significant shift in the process.
The Art of Data Storytelling
A technically perfect control chart can still fail if it doesn't communicate a clear message. The final and most crucial step is to transform your graph from a data repository into a compelling narrative. This is less about statistical rules and more about communication strategy.
The following video from Cole Nussbaumer Knaflic, a leading voice in this field, is a masterclass in this transformation. It outlines a progression from cluttered data to a "stellar story."
This video from the "storytelling with data" channel provides a powerful framework for elevating your data visualizations from simple charts to persuasive narratives.
First, watch the segment on creating "good graphs" by cutting clutter and ensuring consistency. This involves removing distracting elements like borders and gridlines to make the data the hero. Next, focus on the transition to "great graphs" by focusing attention and using words wisely. This is the core of storytelling: using visual contrast (color, line thickness) to guide your client's eye and using action-oriented titles and annotations to state your main point explicitly. Finally, watch the example of weaving these elements into a "stellar story" from the beginning of the presentation walkthrough. Observe how multiple simple, clear graphs are sequenced to build an argument and lead to a specific recommendation. This is the model for a comprehensive client report.
To reinforce these principles, let's look at some quick, practical tips.
Data Storytelling 101 | Think Like a Data Analyst
This video from Christine Jiang offers concise, industry-standard advice on data storytelling that you can apply immediately.
First, watch the segment on standout examples from students. Note how the key insight—the "so what"—is embedded directly in the chart titles and annotations. This is a simple but powerful technique. Next, review the industry best practices. The key takeaways are to avoid cluttered chart types like pie charts, prioritize clarity over "cool" visuals, use color with purpose, and simplify ruthlessly.
Synthesizing the Narrative
Let's bring everything together. Imagine you're presenting results to a client. You have their SCED data and the statistical outputs. How do you present it?
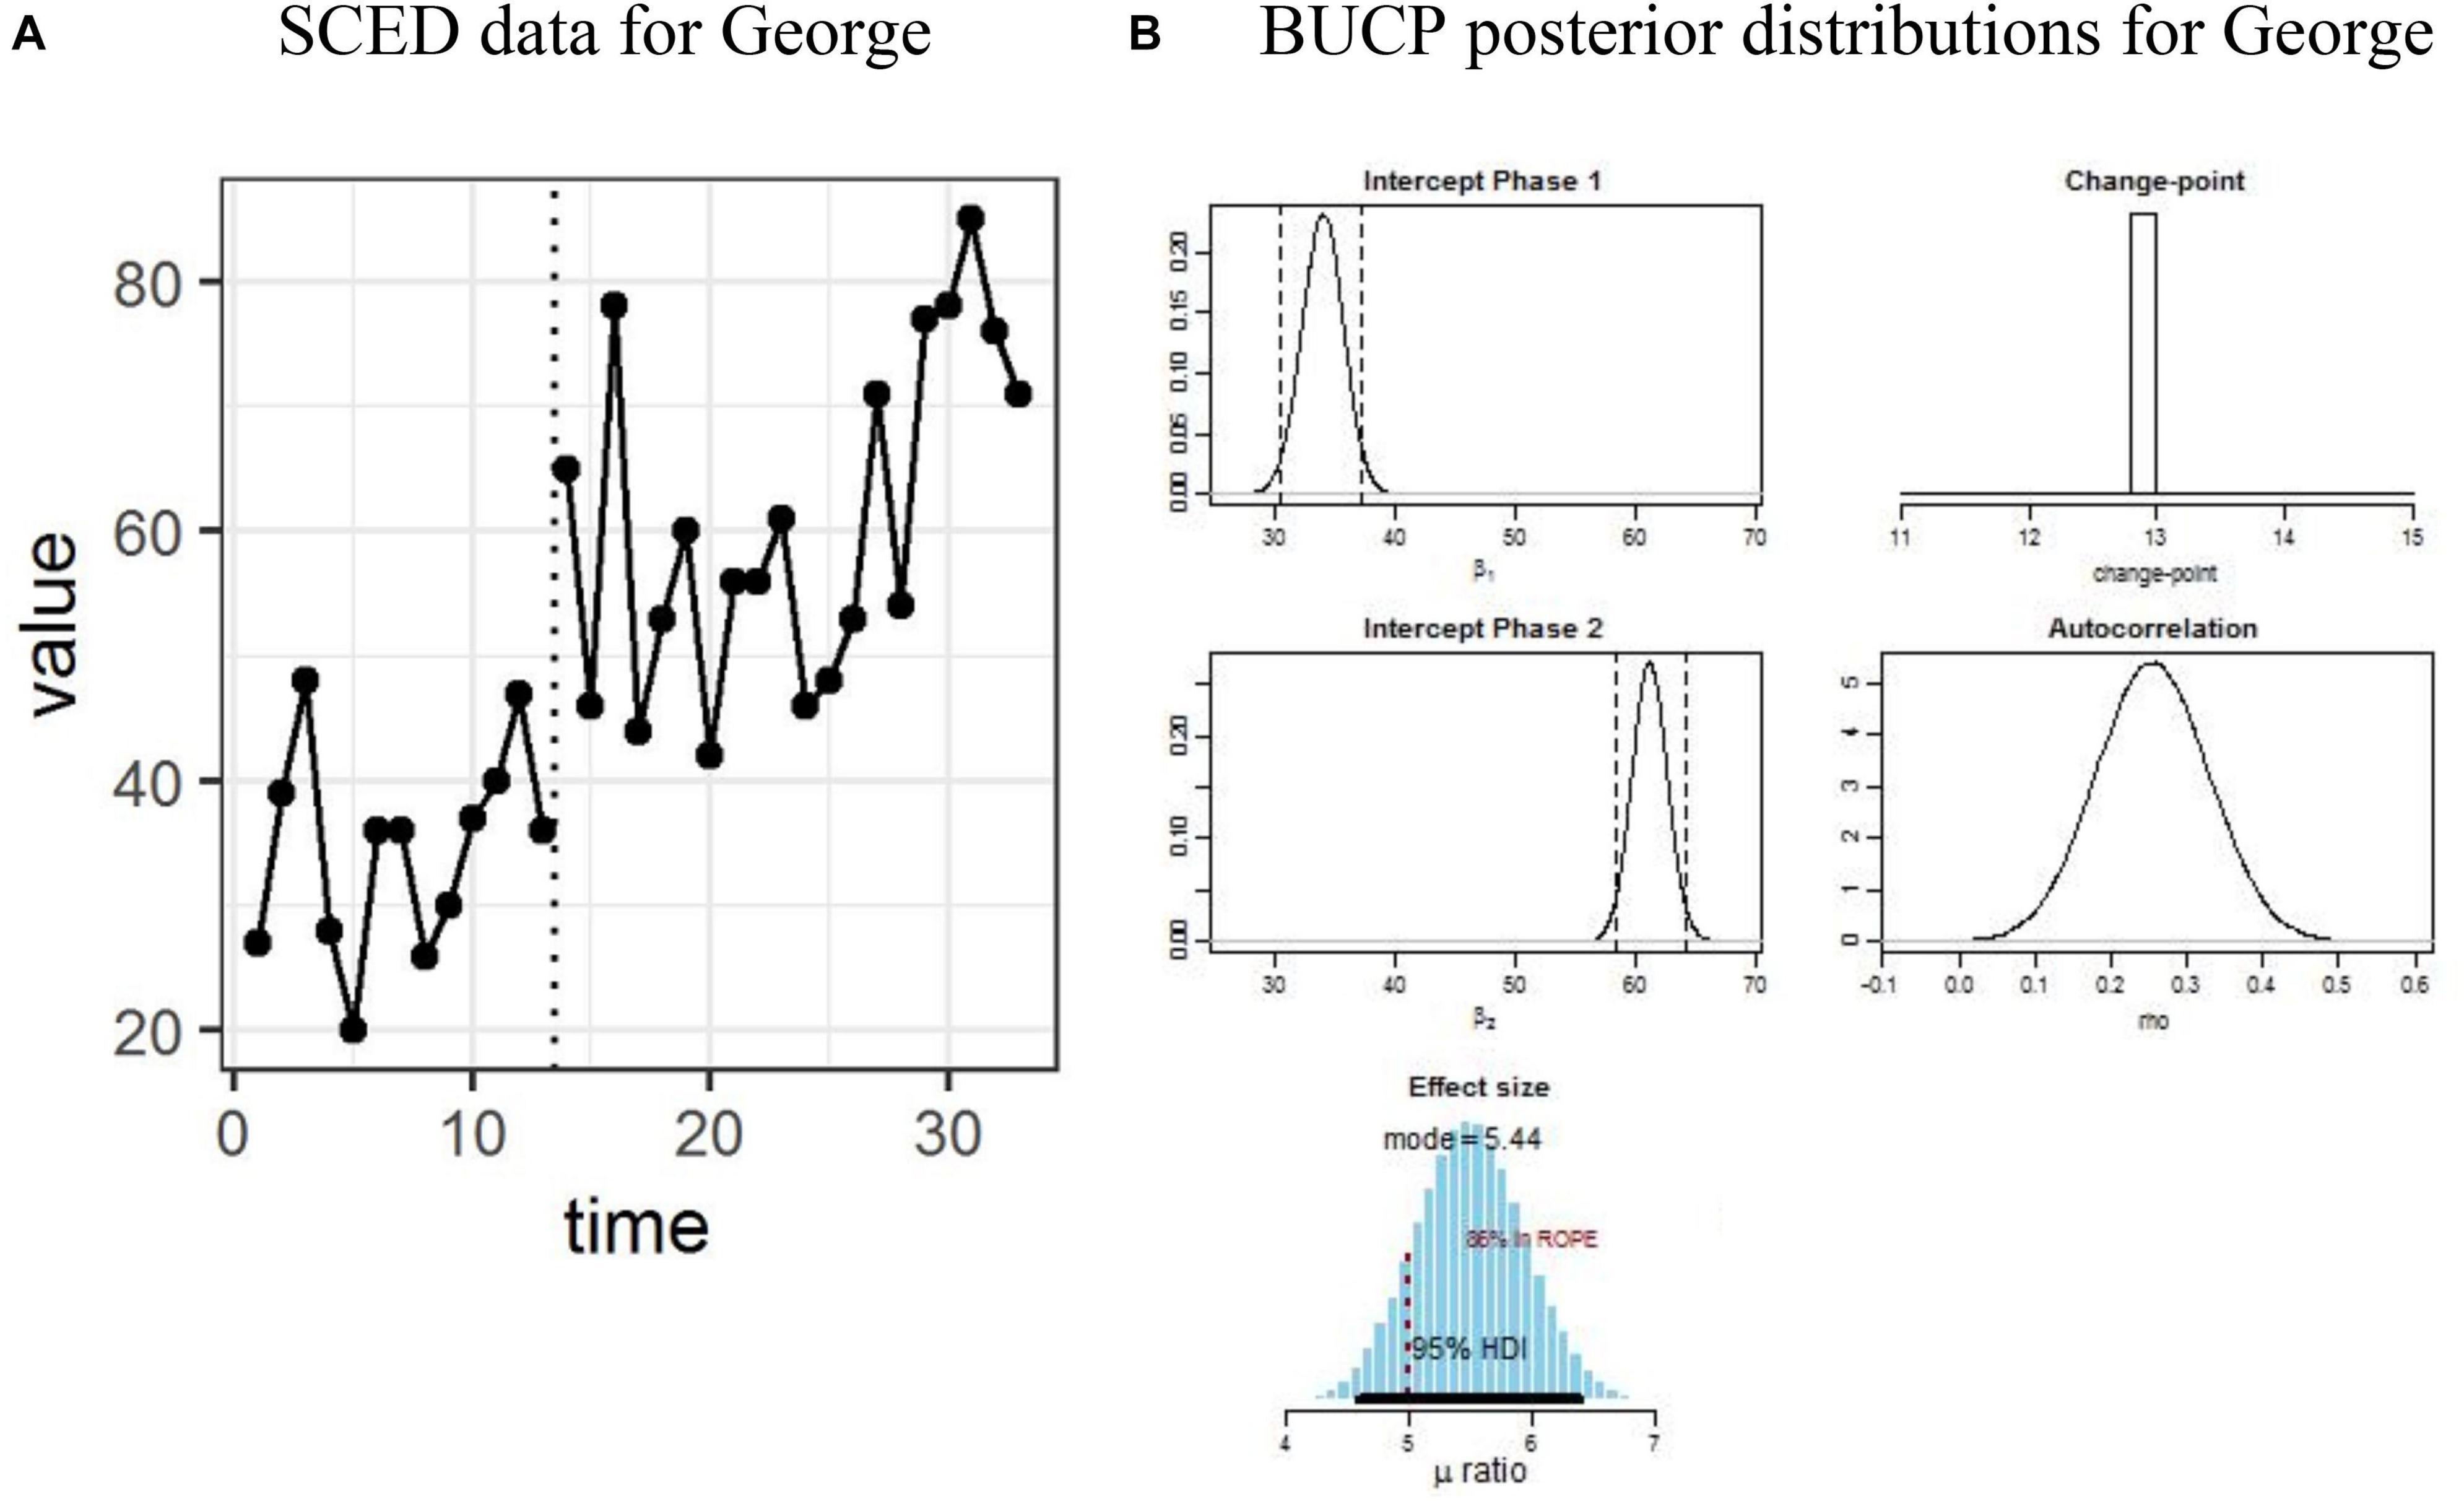
The chart on the left is a good starting point—it's a run chart showing pre- and post-intervention data. The charts on the right are the statistical "proof," which we covered in previous lessons. For a non-technical client, however, showing raw posterior distributions is overwhelming.
Using the storytelling principles, you would transform this into a client-facing graphic by:
- Starting with the run chart (A).
- De-cluttering it: Remove the gray background and simplify the axes.
- Focusing attention: Make the data points in the intervention phase a distinct, positive color like blue or green.
- Using words wisely:
- Change the title from "SCED data for George" to "George's Communication Confidence Doubled After Just Two Weeks."
- Instead of showing the raw posterior plots (B), translate their meaning into a simple annotation on the main graph. For example, add a text box that says: "The data shows a clear and immediate improvement right at the 13-day mark when we started the new exercises. The average score jumped from ~35 to ~60, an effect we can be very confident is real."
This approach respects the data's integrity while making the insight accessible and impactful for the client.
Conclusion
In this lesson, we've focused on the crucial final step of the quantitative coaching process: communication. You now have a framework to move beyond merely presenting data to telling a compelling story with it.
Key Takeaways:
- Start with a Clean Canvas: Use the principles of ABA graphing (clear labels, proportional axes, phase lines) to create a clean, understandable foundation.
- Add Analytical Layers: Incorporate a median line (run chart) or mean/control limits (control chart) to systematically identify trends and shifts. Use the "frozen limits" technique on a control chart for a powerful visual test of your intervention's impact.
- Tell a Story: Apply principles of strategic communication. Cut the clutter, focus attention with color and contrast, and use action-oriented titles and annotations to state your key message directly.
- Translate, Don't Transmit: Your role is to translate complex statistical output into a simple, meaningful narrative for your client. The goal is clarity and demonstrating value, not showing off your analytical process.
This concludes our module on applied quantitative methods. You are now equipped to design interventions, collect data, analyze it with statistical rigor, and communicate the findings persuasively. In our next module, Engagement Closure and Outcome Evaluation, we will put these skills to use as we design the final phase of the client lifecycle, using the very data stories we've learned to construct today to review progress and solidify the value of your engagement.