Hello! Welcome to a new module in your journey to becoming an MIS Executive.
In the previous module, you mastered the art of data visualization, culminating in creating and professionally formatting a PivotChart. You learned that how you present data is just as important as the data itself. But where does that data come from? A powerful chart is only as good as the data source behind it.
This lesson marks the beginning of Module 8: Building Dynamic MIS Reports. We will shift our focus from visualizing data to designing the robust, reliable data sources that are the backbone of any MIS system. Today's learning outcome is to design a structured tracker for business processes (e.g., tasks, incidents) using an Excel Table. This is the foundational skill for creating the trackers and reports you'll manage in an MIS role.
Your experience reviewing cyber incident data and documenting information for recruitment gives you a head start—you already know what kind of information is important. Today, we'll build the Excel system to capture that information cleanly and efficiently.
Why Structure is Everything: From Raw Data to a Smart Tracker
In an MIS role, you'll often receive data that's just a simple list of entries. The first, most critical step is to impose structure on it. A structured tracker is not just a list; it's a system designed for accuracy, scalability, and easy analysis. The best tool in Excel for this job is the Excel Table.
Let's start by understanding the significant advantages of using an Excel Table over a simple range of cells.
How to Make Tables in Excel: The Benefits and Why You Should Use
This article from Xecute The Vision clearly explains why Excel Tables are a non-negotiable for professional data management. Please read it to understand the core benefits we will be leveraging today.
Please read the sections 'Key Benefits of Using Excel Tables' and 'Why You Should Be Using Excel Tables'. Pay close attention to benefits like 'Dynamic Range Reference' and 'Structured References', as these are what make trackers robust.
Step 1: Planning Your Incident Tracker
Before writing a single cell, a good analyst plans the structure. Drawing from your background in cybersecurity, let's design an incident tracker. We need to decide what information (columns) is essential for tracking an incident from start to finish.
A typical incident tracker would include:
- Incident ID: A unique identifier for each issue.
- Date Raised: When the incident was reported.
- Incident Type: The category of the incident (e.g., Data Breach, System Outage, Phishing Attempt).
- Description: A brief of the incident.
- Severity: The urgency (e.g., High, Medium, Low).
- Owner: The person or team responsible for resolving it.
- Status: The current state (e.g., Open, In Progress, Closed).
- Resolution Date: When the incident was closed.
To ensure data consistency (e.g., preventing someone from entering "High" while another enters "H"), we'll use dropdown lists. The best practice is to store the options for these lists on a separate worksheet.
Create an Issue List in Excel | Issue Management for Project Management } Issue Log creation
This video from Project Management Mastery demonstrates how to set up a dedicated 'settings' tab to hold parameters for your tracker. This is a key step in building a professional and maintainable Excel file.
Watch from 00:41 to 02:17. Observe how the presenter creates a 'Settings' sheet and defines lists for 'Issue Status', 'Issue Severity', and 'Issue Category'. We will do the same for our tracker.
Step 2: Hands-On - Building the Tracker
Now it's time to build. Please open a new, blank Excel workbook to follow along.
A. Create the 'Settings' Worksheet
- Rename
Sheet1to Tracker. - Add a new sheet and rename it Settings.
- On the Settings sheet, create the lists for our dropdowns as shown below. These lists will ensure consistent data entry.
| A | B | C |
|---|---|---|
| Status | Severity | Type |
| Open | High | Data Breach |
| In Progress | Medium | System Outage |
| Closed | Low | Phishing Attempt |
| On Hold | Access Issue |
B. Define the Tracker Structure
- Switch to the Tracker worksheet.
- Enter the following headers in the first row, from cell A1 to H1:
Incident ID,Date Raised,Incident Type,Description,Severity,Owner,Status,Resolution Date.
C. Convert to an Excel Table
This is the most crucial step. We will convert our simple range of headers into a dynamic Excel Table.
- Click any cell within your headers (e.g., A1).
- Press Ctrl + T on your keyboard.
- A "Create Table" dialog box will appear. Ensure that the range is correct and that the "My table has headers" box is checked.
- Click OK.
Your headers will now be formatted, and you'll see filter dropdowns on each one. You've officially created an Excel Table!
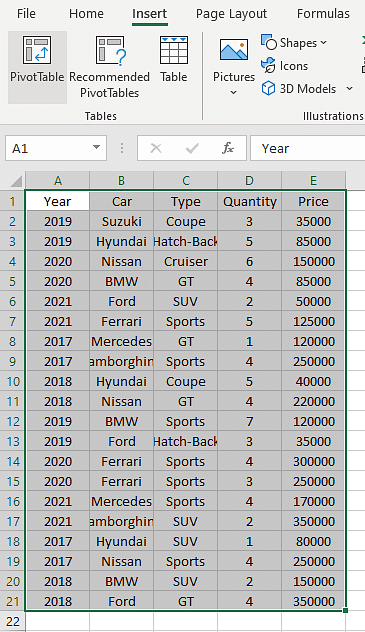
D. Add Data Validation (Dropdown Lists)
Now, let's link our tracker to the lists on the Settings sheet to create dropdown menus. This enforces data integrity.
Create an Issue List in Excel | Issue Management for Project Management } Issue Log creation
Let's return to the Project Management Mastery video. This segment will walk you through applying data validation to your columns, using the lists we just created.
Watch from 03:22 to 06:15. Focus on the process of selecting a column, going to Data > Data Validation, choosing 'List', and selecting the source from the 'Settings' sheet. You will replicate this for three columns.
Now, apply this to your tracker:
- For Incident Type:
- Click on cell C2 (the first empty cell under the "Incident Type" header).
- Go to the Data tab > Data Validation.
- In the "Allow:" dropdown, select List.
- In the "Source:" box, click the arrow, go to the Settings sheet, and select the cells containing your list of types (C2:C5). Press Enter and click OK.
- For Severity: Repeat the process for cell E2, but for the "Source", select the Severity list from your Settings sheet.
- For Status: Repeat the process for cell G2, using the Status list from your Settings sheet.
Because we are using an Excel Table, these data validation rules will automatically copy down as you add new rows!
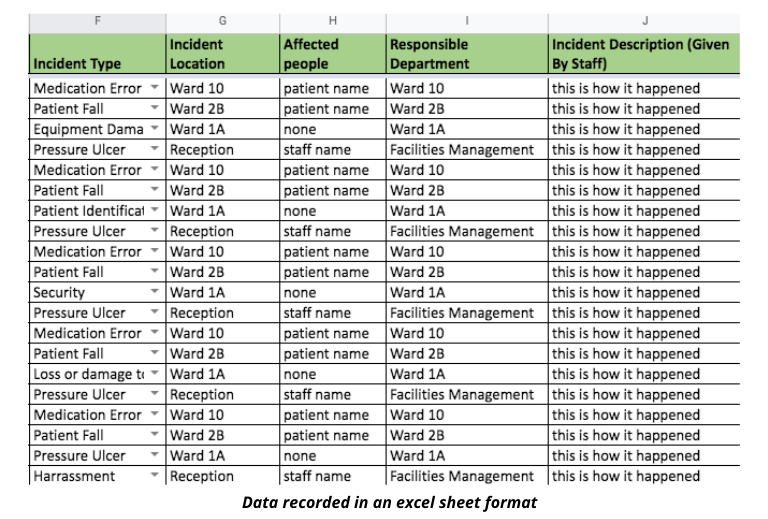
Your tracker structure is now complete. It should look something like this, ready for data entry.
Step 3: Witness the Power of Tables
Let's add a sample record to see the dynamic nature of the table.
- Enter the following data into row 2. Use the dropdowns you created for 'Incident Type', 'Severity', and 'Status'.
| Incident ID | Date Raised | Incident Type | Description | Severity | Owner | Status | Resolution Date |
|---|---|---|---|---|---|---|---|
INC-001 |
01-Oct-24 |
Phishing Attempt | User reported suspicious email | High | John Smith | Open |
- Now, move your cursor to cell A3 (right below 'INC-001') and start typing
INC-002. Notice how the table automatically expands to include the new row, complete with formatting and the data validation dropdowns you created.
This automatic expansion is one of the most powerful features of Excel Tables and is essential for creating scalable MIS trackers.
Make a Dynamic Task Management Tracker in Excel!
To see this dynamic behavior in action, watch this short clip from Kenji Explains. He adds a new task to his tracker and you can see how all formatting and formulas instantly apply.
Watch from 15:43 to 16:15. The key takeaway is seeing how adding a new row automatically makes it part of the table, ready for data entry.
Conclusion
Excellent work! You have successfully designed and built a structured tracker, which is the absolute foundation of any MIS report. You didn't just create a list; you engineered a small system with rules and structure that ensures data quality and makes future analysis much easier.
Key Takeaways:
- Plan First: Always define the columns you need before you start building in Excel.
- Use a 'Settings' Sheet: Centralize your dropdown lists on a separate sheet to keep your workbook organized and easy to update.
- Convert to an Excel Table Immediately: Use Ctrl + T to turn your data range into a Table to unlock dynamic features.
- Enforce Rules with Data Validation: Use dropdown lists for key fields to prevent typos and ensure data consistency.
- Tables are Dynamic: New rows automatically inherit formatting, data validation, and (as you'll see soon) formulas.
In our next lesson, we will make this tracker even smarter. You will learn how to write formulas within the tracker to auto-calculate metrics like turnaround time or aging, adding another layer of automation to your MIS tool.