Hello! Welcome back.
In our last lesson, you built a dynamic PivotChart linked to an incident tracking PivotTable and learned how to make it interactive with Slicers. This was a huge step in creating reports that allow users to explore data themselves.
Today, we'll focus on the final, critical step: presentation. A well-structured report can lose its impact if the visuals are cluttered or unprofessional. Our goal for this lesson is to master the techniques needed to format chart elements (titles, axes, data labels, colors) for a professional presentation.
We'll take the raw PivotChart you built and transform it into a clean, clear, and compelling visual that's ready for any MIS report or management dashboard.
The Anatomy of a Chart
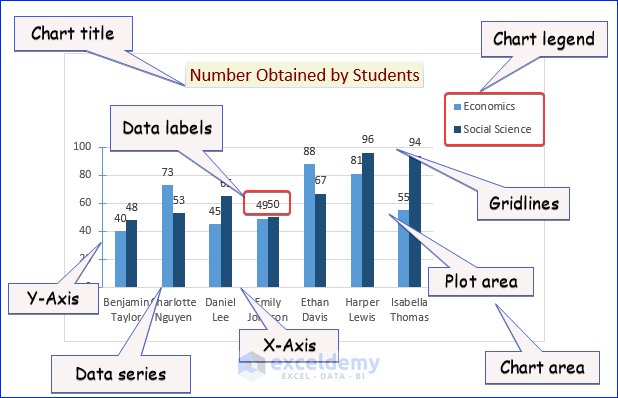
Before we start formatting, let's quickly identify the different parts of a chart we can customize. Each labeled element in the image below can be individually modified.
For this lesson, please open the Excel file from our previous session containing the IncidentData PivotTable and its associated PivotChart. We will be working on that chart directly.
Your Formatting Toolkit in Excel
Excel offers several ways to access formatting options, which gives you a lot of flexibility. The main methods are:
- The Ribbon: When you select a chart, two contextual tabs appear:
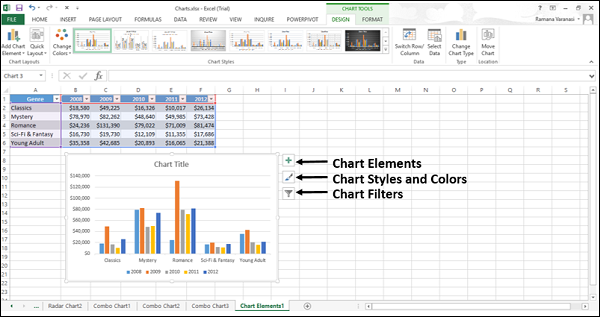
Chart DesignandFormat. These tabs contain a wealth of options for changing the chart's structure and appearance. - Chart Shortcut Buttons: Three buttons appear on the top-right of a selected chart. These provide quick access to the most common formatting tasks.
- Right-Click Menu: Right-clicking on any chart element (like an axis, a bar, or the title) brings up a context-sensitive menu with relevant formatting options.
- Format Pane: Double-clicking any chart element opens a detailed
Formatpane on the right side of your screen. This pane gives you the most granular control over every aspect of the selected element.
Hands-On: Polishing Your Incident Status Chart
Let's apply these tools to the PivotChart you created. We'll go element by element to transform it into a professional visual.
1. Crafting a Clear and Dynamic Title
A chart's title should be concise and descriptive. Your current chart likely has a generic title. Let's fix that and add an axis title for clarity.
Excel Charts and Graphs Tutorial
This video from Kevin Stratvert provides a great walkthrough on editing titles. Pay special attention to the trick for making a title dynamic—it's a very useful technique for MIS reports.
Please watch from 07:45 to 10:24. Focus on these two key actions: Editing the Chart Title (07:45 - 08:53): See how to manually change the title text and how to link it to a cell for automatic updates. Adding Axis Titles (08:53 - 10:24): Observe how to add a title for the vertical (Y) axis to explain what the numbers represent.
Now, apply this to your chart:
- Change the Chart Title: Click on the chart title and change it to "Incident Status by Department".
- Add a Vertical Axis Title: Click the
Chart Elements(+) button, checkAxis Titles, and then uncheckPrimary Horizontalto keep only the vertical axis title. Change its text to "Number of Incidents".
2. Decluttering for Clarity
Professional charts are clean and easy to read. A common mistake is including too many distracting elements. Let's remove the clutter from your PivotChart.
Microsoft Excel Chart Formatting Tips and Tricks
Simon Sez IT has an excellent video on formatting tricks. This first clip shows how to remove unnecessary elements that often clutter a default PivotChart.
Watch from 17:21 to 19:19. The instructor demonstrates how to remove: The Legend: Since we can label the bars directly, the legend is redundant. Field Buttons: These grey buttons are useful for quick filtering but can be removed for a cleaner final presentation, especially when you are providing Slicers.
Your Turn:
- Hide Field Buttons: Right-click on one of the grey field buttons (e.g., "Status") on your chart and select "Hide All Field Buttons on Chart".
- Remove the Legend: Click on the legend (which likely shows 'Open' and 'Closed') and press the
Deletekey. - Soften the Gridlines: Click on one of the horizontal gridlines. In the
Formatpane that appears (or right-click and chooseFormat Gridlines), change the line color to a light grey. This makes them less distracting but still useful as a guide.
3. Enhancing Data Labels and Bars
With the clutter gone, let's make the core data easier to read by adding data labels and adjusting the bars.
Microsoft Excel Chart Formatting Tips and Tricks
Let's continue with the Simon Sez IT video. This next segment is packed with valuable tips on making your data stand out.
Watch from 19:19 to 24:24. Pay close attention to these techniques: Adjusting Gap Width (20:45): This makes the columns wider and gives them more visual weight. Adding and Positioning Data Labels (22:00): Notice how adding labels makes the chart more informative. Removing the Y-Axis (22:30): Once you have data labels, the vertical axis is often unnecessary. Removing it is a great decluttering move. Formatting Label Numbers (23:45): See how to change the number format on the labels themselves.
Apply these powerful techniques:
- Widen the Bars: Click on any of the data bars. In the
Format Data Seriespane, underSeries Options, reduce the Gap Width to around100%. - Add Data Labels: With the bars still selected, click the
Chart Elements(+) button and checkData Labels. Position themInside Endfor a clean look. - Remove the Vertical Axis: Now that you have labels, click on the vertical axis (the one showing the numbers) and press the
Deletekey. Do the same for the "Number of Incidents" axis title, as it's now redundant.
Your chart should now look much cleaner and more direct.
4. Using Color with Purpose
Color is a powerful tool for communication. Instead of using default colors, let's assign colors that add meaning to the data. For incidents, a common convention is red for "Open" (needs attention) and green for "Closed" (resolved).
- Click on one of the "Open" bars. This will select all "Open" bars in the chart.
- Go to the
Formattab on the ribbon, clickShape Fill, and choose a shade of red. - Now, click on one of the "Closed" bars. This will select all "Closed" bars.
- Go back to
Shape Filland choose a shade of green.
By using color this way, you're making the chart's story instantly understandable even at a glance.
The Principles of Professional Formatting
You've just applied several key formatting techniques. To ensure you understand the "why" behind these changes, it's helpful to review some established best practices.
Formatting rules - Government Analysis Function
The UK Government's Analysis Function publishes excellent, straightforward rules for data visualization. Reading these will help you internalize the principles of creating clean, effective charts.
Please read the following sections to solidify your understanding: 'Keeping your data visualisations simple' 'Chart backgrounds' 'Horizontal text' 'Chart labels – alignment, font, colour, commas' 'Gridlines' Focus on the core message: remove everything that doesn't add direct value to the chart's message.
The guiding principle is clarity. Every element on your chart should serve a purpose. If it doesn't help the audience understand the data, it's probably just noise.
Conclusion
Well done! You have transformed a default Excel chart into a professional-quality visual. This skill is exactly what hiring managers look for in an MIS role—the ability to not just analyze data, but to present it in a way that is clear, insightful, and ready for decision-makers.
Key Takeaways:
- Declutter Aggressively: Remove redundant legends, busy gridlines, unnecessary axes, and chart field buttons to focus the viewer's attention.
- Be Explicit with Titles and Labels: Use clear chart and axis titles. Use data labels to show precise values, which can often replace an entire axis.
- Use Color Purposefully: Don't just decorate; use color to communicate meaning, such as using red for problems (Open incidents) and green for successes (Closed incidents).
- Format for Readability: Widen bars (adjust Gap Width) and ensure all text is horizontal and easy to read.
In our next lesson, we will begin a new module, "Building Dynamic MIS Reports." We'll shift our focus from visualizing data to designing the source of that data. You'll learn how to design a structured tracker for business processes using an Excel Table, a foundational skill for building any robust MIS system.