Introduction
Welcome to the final lesson of your capstone project and the entire course! In the last session, you accomplished a major milestone by transforming your PivotTable summary into a fully interactive dashboard. You now have a powerful tool for exploring recruitment data, complete with dynamic charts and slicers.
Today, we'll focus on the final, critical step for any MIS Executive: taking that powerful tool and using it to communicate a clear, professional story. This lesson addresses the final learning outcome of this module: to assemble a professional weekly MIS report with charts, summary tables, and analytical commentary.
A dashboard is for exploration; a report is for communication. We will bridge that gap by learning how to finalize your visuals, extract key performance indicators (KPIs), and—most importantly—write the analytical commentary that provides context and turns data into actionable insights for management. By the end of this lesson, you will have a complete, professional report package that directly reflects the work you'll do in an MIS role.
1. The Anatomy of a Professional MIS Report
First, let's clarify what a "weekly MIS report" is. It's more than just a data file; it's a structured communication designed to inform decision-making. Based on your experience with structured documentation, you'll appreciate that a good report has clear, distinct components.
Excel MIS Report: What it is, Types & Steps to Create it
To understand the context and purpose of an MIS report in a business setting, let's review this article from Simplilearn.
Read the sections "What Is Excel MIS Report?" and "Types of Excel MIS Reports". Pay special attention to the description of Batch-Processed/Scheduled Reports, as a weekly report falls directly into this category.
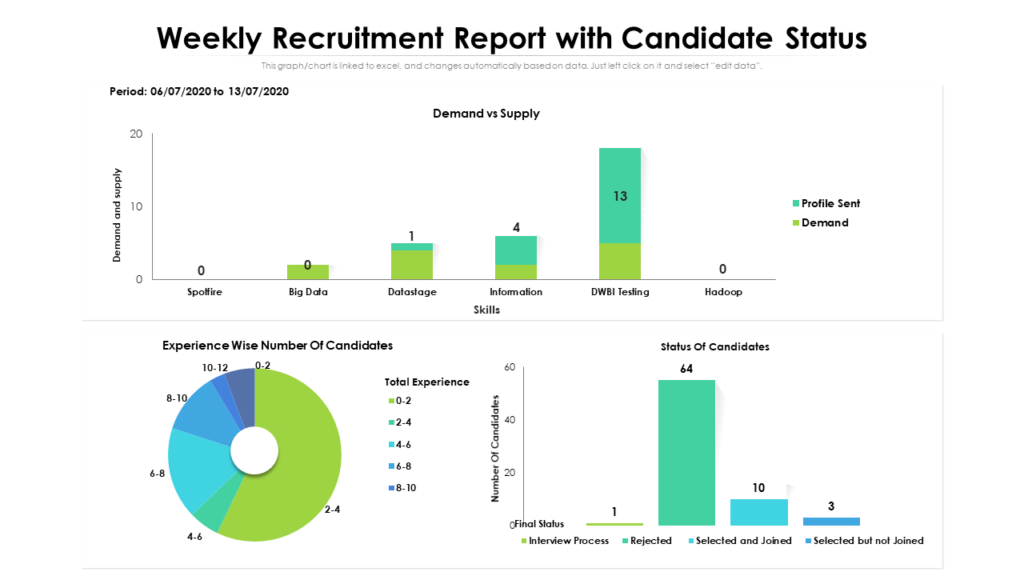
As the article describes, a scheduled report is a recurring update. For a weekly recruitment report, the key components are typically:
- Visuals (Charts): A snapshot of the main dashboard to give a quick overview of the situation.
- Summary Tables/KPIs: A high-level view of the most critical numbers (e.g., total candidates, number of hires).
- Analytical Commentary: Bullet points that explain what the data means, highlight key trends, and flag potential issues or successes.
2. Polishing Your Dashboard for Presentation
The dashboard you built is the visual centerpiece of your report. Before you share it, you need to ensure it's polished and professional. This means clean formatting, clear titles, and a consistent design.
The Ultimate Excel Dashboard: Visualize Data Like a Pro
The YouTuber Chandoo is an Excel expert known for creating beautiful reports. This video demonstrates how to add the final touches that separate a functional dashboard from a professional one.
Please watch from 26:22 to 27:58. Focus on two key actions: How to add clear, meaningful titles to each chart. How to apply a consistent color scheme to align the report with a corporate style.
Your Turn: Finalize Your Dashboard
- Open your
MasterTrackerExcel file from the previous lesson. - Go to your Dashboard worksheet.
- Add Clear Titles: Make sure every chart and slicer area has a descriptive title. For example: "Active Candidates by Recruiter" and "Recruitment Funnel." Add a main title to the dashboard itself, like "Weekly Recruitment Pipeline Report - Week Ending [Date]".
- Review Formatting:
- Are your charts and slicers neatly aligned? (Tip: Hold the
Altkey while dragging to snap objects to the cell grid). - Is the font style and size consistent?
- Have you removed distracting elements like chart field buttons and gridlines? (You did this last lesson, but it's good to double-check).
- Are your charts and slicers neatly aligned? (Tip: Hold the
3. Creating a High-Level KPI Summary
While the dashboard is great for visual analysis, senior managers often want a few key numbers right at the top. A best practice is to create a small, clean summary table that presents the most important KPIs.
We can create a clean "display area" that pulls data directly from your PivotTables, ensuring it's always up-to-date.
The Ultimate Excel Dashboard: Visualize Data Like a Pro
Let's return to the Chandoo video to learn a powerful technique for creating a KPI summary section.
Watch from 05:53 to 10:43. Pay close attention to how he builds a 'display area' in the cells next to the PivotTable. He uses simple formulas (=G4) to link to the PivotTable results and then uses text boxes on the dashboard to display these values dynamically. This separates the calculation from the presentation, which is a core MIS principle.
Your Turn: Build Your KPI Summary
- Go to your Calcs worksheet where your PivotTables are located.
- Next to your main PivotTable, create a small summary section. For example:
- In one cell, type the label "Total Active Candidates". In the cell next to it, write a formula that points to the Grand Total of your main PivotTable.
- In another cell, type "Candidates in Interview". In the cell next to it, point to the total for the 'Interview' stage.
- Add 1-2 more KPIs that you think are important (e.g., "Candidates in Offer Stage").
- Now, go to your Dashboard sheet.
- Insert a Text Box (Insert > Text > Text Box).
- With the text box selected, click in the Formula Bar, type
=, and then click the cell in your Calcs sheet that contains the "Total Active Candidates" value. Press Enter. - The text box is now dynamically linked to your data! Format it to look professional (e.g., larger font, bold).
- Repeat this to create text boxes for your other KPIs, arranging them neatly at the top of your dashboard.
4. The Core Skill: Writing Analytical Commentary
This is arguably the most important skill for an MIS Executive. Your value isn't just in making charts, but in explaining what they mean. Good commentary answers the "So what?" question for your audience.
A simple but effective framework for commentary is:
Observation + Insight = Actionable Commentary
- Observation: A simple statement of fact from the data.
- Example: "The funnel chart shows a 60% drop-off from the 'Interview' to the 'Offer' stage for the Data Scientist role."
- Insight: Your interpretation of what that fact means for the business.
- Example: "This high drop-off rate may suggest that our salary offers are not meeting candidate expectations or that competitors are making more compelling offers during the final stages."
4 Best Practices For Creating a Variance Report in Excel
This article from Vena Solutions explains how to provide answers to management's questions directly within a report. The principles apply perfectly to writing weekly commentary.
Read the section titled "3. Insert Comments". Focus on the types of questions management might ask and the three things your comments should address: the cause of the variance (or trend), whether it's an anomaly, and its business impact.
5. Assembling Your Weekly Report Package
Now, let's put everything together into a professional package that you could send to a hiring manager.
Your "End of Week" Simulation
Imagine it's Friday afternoon. It's time to prepare your weekly recruitment update.
Step 1: Refresh and Filter
- First, ensure your data is current. Go to the Data tab and click Refresh All. This updates your Power Query connection and all PivotTables.
- Use your slicers to explore the data. Click on a specific
Job TitleorRecruiter. Look for anything that stands out.
Step 2: Identify Key Stories
Look at your dashboard and ask yourself:
- What is the most important message this week?
- Is there a bottleneck forming in the funnel? (e.g., lots of candidates in one stage).
- Is one recruiter significantly overloaded compared to others?
- For a key role, how is the pipeline health?
Step 3: Draft Your Commentary
Based on your findings, write 2-3 bullet points of analytical commentary. For example:
- Observation: Recruiter Priya Singh's pipeline has 15 candidates, with 10 of them in the 'Screening' stage.
Insight: Priya may be facing a bottleneck in initial screenings. We should check if she needs support or if there's an issue with the quality of incoming applications for her roles. - Observation: The funnel for the 'Software Engineer' role shows a healthy conversion rate of 80% from Screening to Interview.
Insight: This indicates that the initial screening process for this role is highly effective at identifying qualified candidates, saving valuable interviewer time.
Step 4: Assemble the Report Email
This is your final deliverable. You would typically send this in an email or present it on a single slide.
Here is a template for an email to a hiring manager:
Subject: Weekly Recruitment Pipeline Report - Week Ending [Date]
Hi [Hiring Manager Name],
Please find below the summary of our recruitment pipeline for this week.
Key Metrics:
- Total Active Candidates: [Your KPI]
- Candidates in Interview Stage: [Your KPI]
- Candidates with Offers: [Your KPI]
This Week's Key Insights:
- [Your first commentary bullet point here.]
- [Your second commentary bullet point here.]
- [Your third commentary bullet point here.]
A screenshot of the full interactive dashboard is attached for a more detailed view. Please let me know if you have any questions.
Best regards,
[Your Name]
MIS Executive
To complete this step, you would:
- Copy the values from your KPI summary.
- Write your commentary bullet points.
- Take a screenshot of your polished dashboard and save it as an image to attach.
Conclusion
Congratulations! You have officially completed the Recruitment Pipeline capstone project and your course on becoming an MIS Executive. You have progressed from handling raw data to building a fully interactive dashboard and, finally, assembling a professional, insightful weekly report. This entire project is a powerful, real-world example of the skills you can now bring to a potential employer.
Your key takeaways from this final lesson are:
- A professional MIS report combines visuals, a KPI summary, and analytical commentary.
- Polishing your dashboard with clear titles and consistent formatting is essential for presentation.
- Analytical commentary is the critical skill of explaining what the data means by combining observations with business-relevant insights.
- The final report is a communication package, often delivered via email or presentation, that tells a clear story to stakeholders.
You have demonstrated an end-to-end understanding of the MIS workflow. This capstone project is now a key asset for your CV and a talking point in interviews that proves you have the practical, hands-on skills required for the job you want. Well done